GBP/JPY Price Analysis: Holds to its gains amongst risk-aversion, doji formation signals indecision
- The formation of a bullish-engulfing candlestick pattern suggests GBP/JPY may continue to trend up.
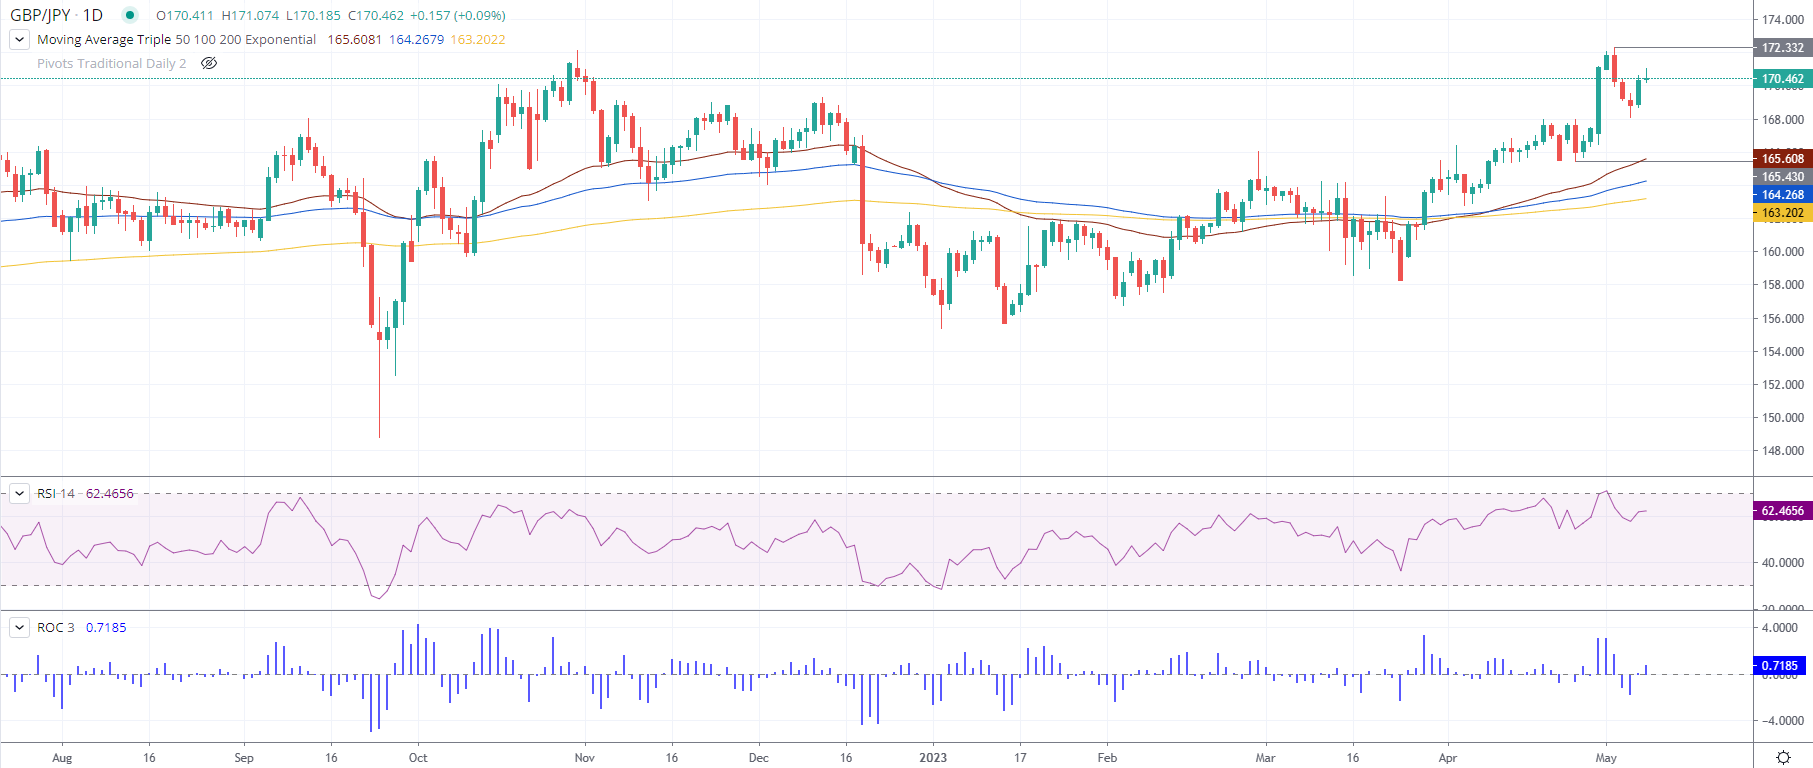
- RSI indicator suggests buyers remain in charge, 3-day RoC climbs from neutral territory.
- GBP/JPY may face resistance at 171.00 and YTD high of 172.33, support at 170.00, and last week’s low of 168.06.
The GBP/JPY holds to its earlier gains, despite falling from its daily high of 171.07, as risk aversion triggered flows toward safe-haven peers, which bolstered the Japanese Yen (JPY). Nevertheless, it was not enough to turn the cross-currency pair negative, as shown by price action. The GBP/JPY is trading at 170.50, above its opening price by 0.11%.
GBP/JPY Price Action
After completing the formation of a bullish-engulfing candlestick pattern last Friday, the GBP/JPY would likely continue to trend up. Nevertheless, it hit a bump after GBP/JPY’s Monday price action is forming a doji, suggesting indecision amongst GBP/JPY traders.
Although price action would likely remain sideways, the Relative Strength Index (RSI) indicator suggests buyers remain in charge. While the 3-day Rate of Change (RoC) climbed from the neutral territory, showing buyers are moving in.
If GBP/JPY remains in an uptrend, the first resistance level would be 171.00. A breach of the latter will expose the YTD high of 172.33, followed by the 173.00 mark.
Conversely, if GBP/JPY sellers outpace buyers, the first support would be 170.00. Once cleared, the GBP/JPY could test the last week’s low of 168.06, followed by the intersection of the April 25 daily low and the 50-day EMA at around 165.43/60, respectively.
GBP/JPY Daily Chart