NZD/JPY Price Analysis: Bears exert control, subtle signs of bullish comeback appear
- The NZD/JPY is currently trading at 91.26, down by 0.45%.
- On the daily chart, increasing selling traction is reflected by the RSI in the negative territory.
- On the hourly chart, signs of mounting buyers' momentum are shown by the recovering RSI.
- At a larger scale, the bullish trend remains intact.
In Tuesday's session, the NZD/JPY is currently trading at 91.26, reflecting a decrease of 0.45% with sellers demonstrating a solid stance. Nonetheless, the general sentiment remains somewhat mixed. While the bearish momentum is clear, the pair's position above key Simple Moving Averages (SMAs) suggests an overall persistent bullish bias. In addition, buyers seem to be bullying momentum on the hourly chart.
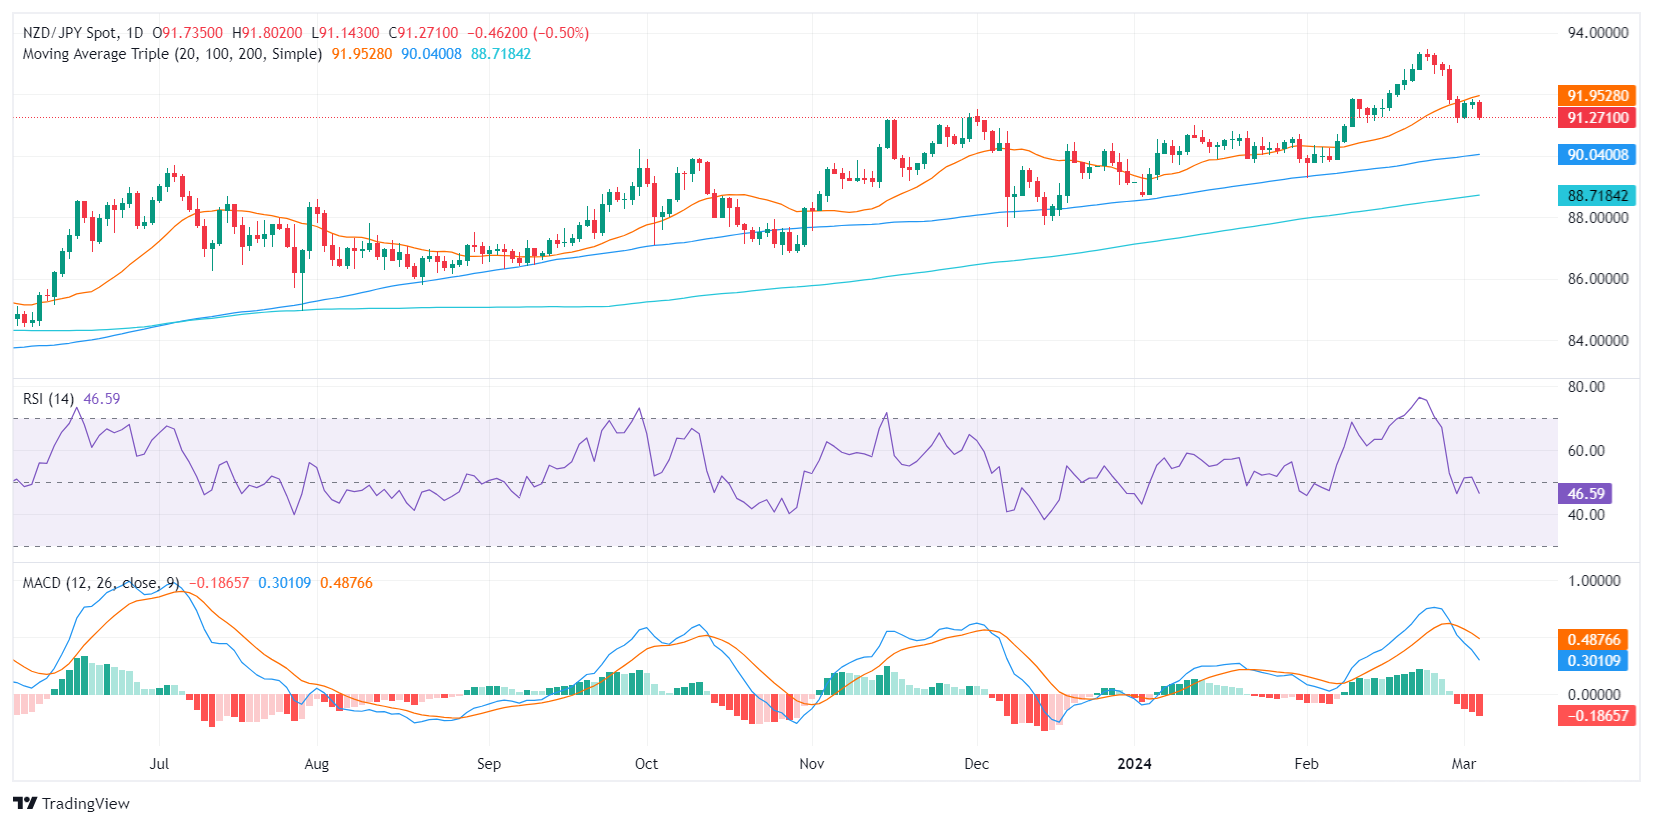
On the daily chart of NZD/JPY, the Relative Strength Index (RSI) is currently in negative territory, recognizing the dominant sellers in the market. Following a peak in the overbought zone on February 23, the RSI has descended, revealing a significant drop in buying strength. Similarly, the Moving Average Convergence Divergence (MACD) histogram supports this bearish stance, as signified by the rising red bars, typically suggesting a negative momentum.
NZD/JPY daily chart
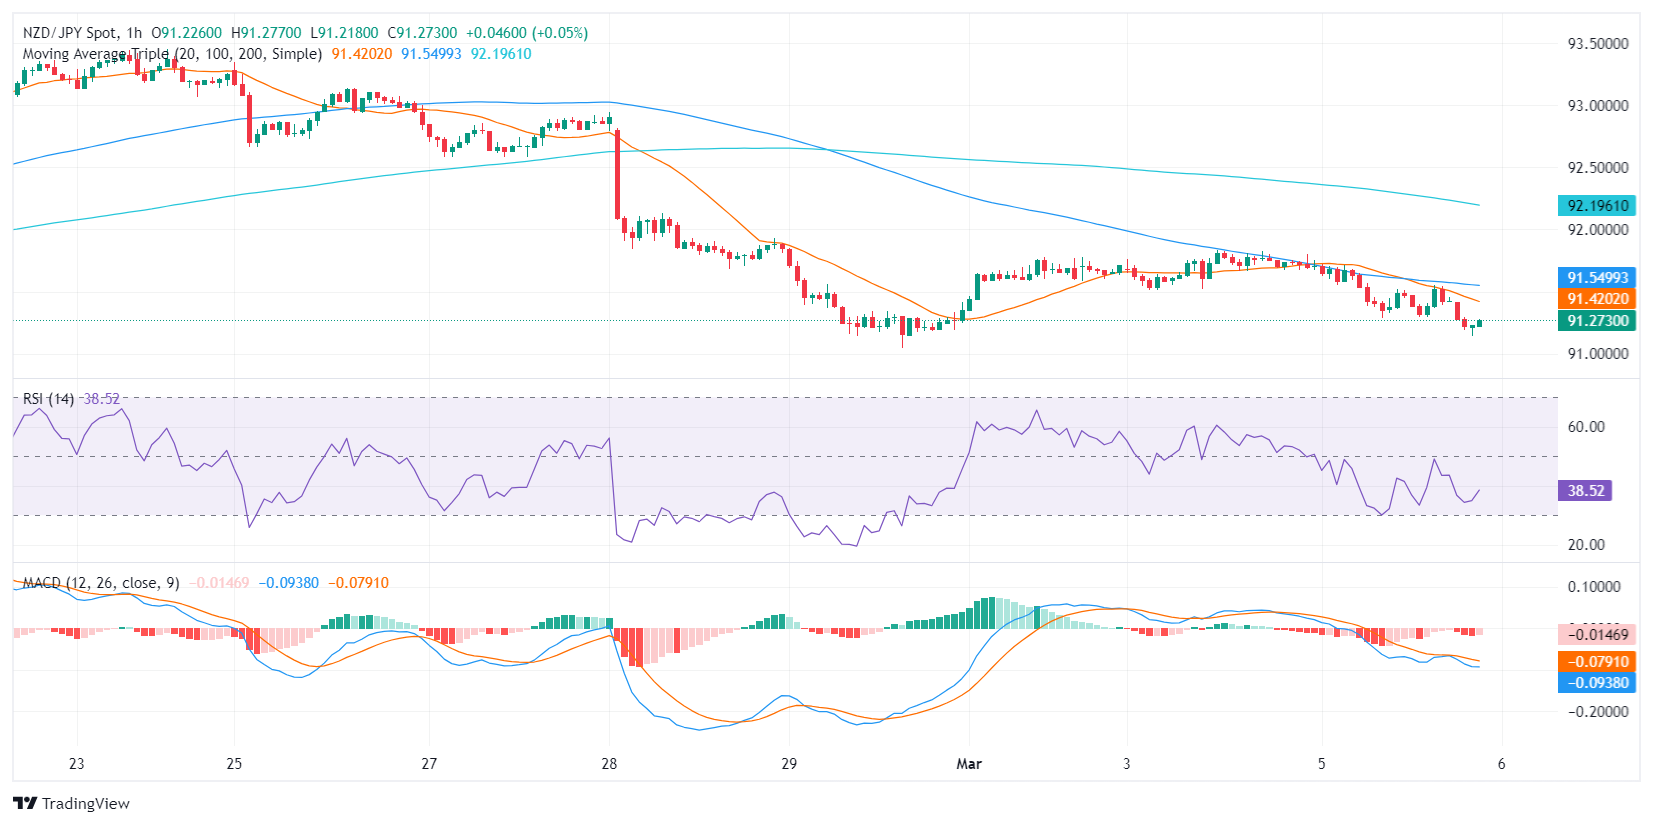
Analyzing the hourly chart, however, it presents contrasting observations. The RSI has shown an upward movement from the oversold territory in the last sessions, hinting at a potential increase in buyers’ traction. Regardless, the MACD histogram hints at negative momentum reflected through its steady red bars.
NZD/JPY hourly chart
In the larger context, notwithstanding this intra-day bearish outlook, the pair still holds a bullish stance in an overall trend, by staying above the 100 and 200-day Simple Moving Averages (SMAs). Hence, while short-term traders could look for selling opportunities, long-term investors may still hold onto their bullish rhetoric.