NZD/USD Price Analysis: Pair rises near 0.5700, but bearish pressure still dominates
- NZD/USD trades near the 0.5700 zone after modest gains ahead of the Asian session.
- Despite short-term buy signals, broader trend remains bearish due to pressure from key moving averages.
- Support rests at 0.5692 while resistance lies around 0.5708–0.5718; 200-day SMA reinforces downside risks.
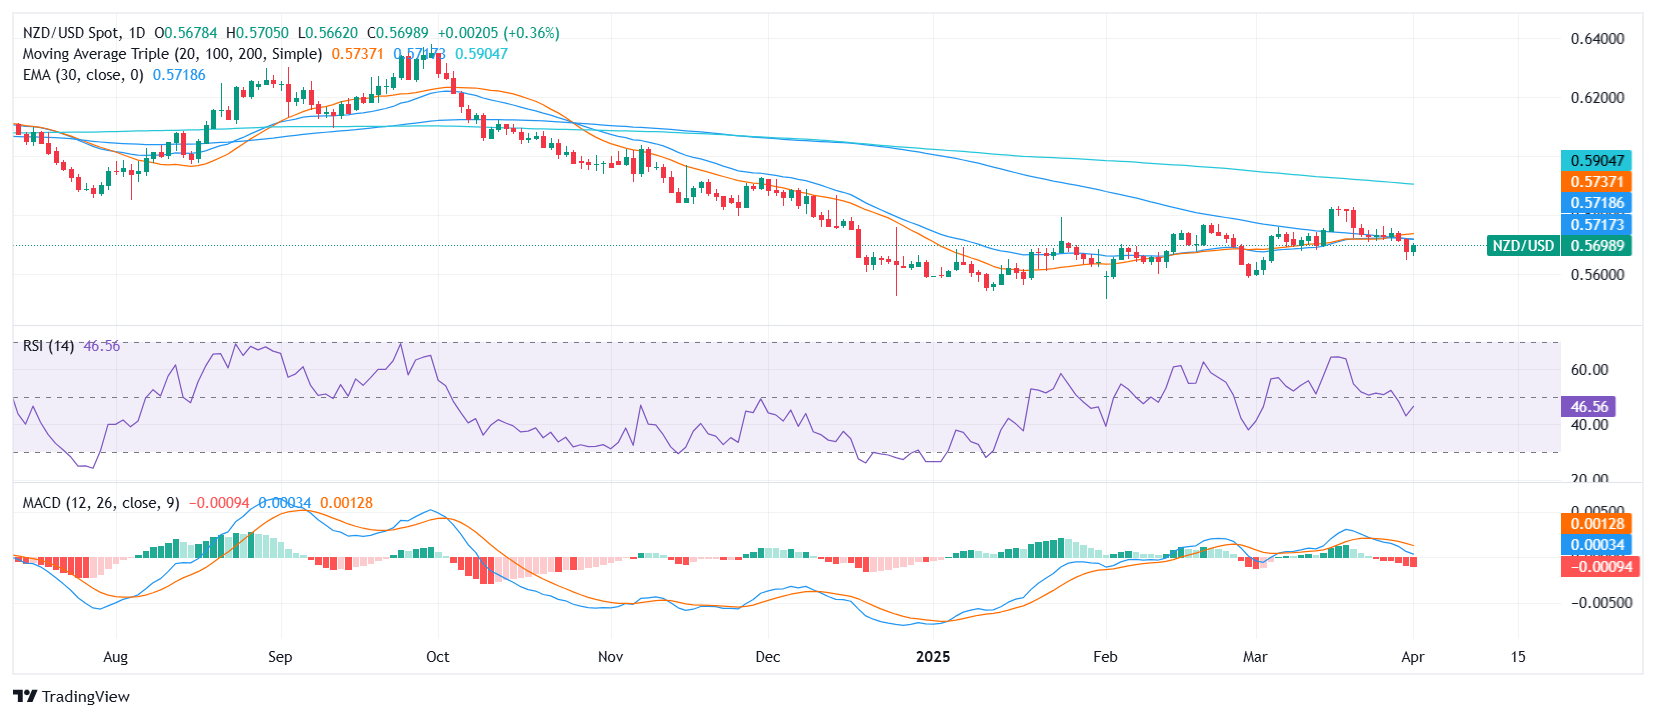
The NZD/USD pair showed modest bullish momentum on Tuesday’s session, climbing slightly and hovering around the 0.57 zone ahead of the Asian session. Despite the upside move, the broader setup remains bearish as the price continues to be capped by long-term moving averages and oscillators still suggest underlying weakness.
Daily chart

The standard 14-period RSI stands at 46.01, offering a neutral outlook, while the Awesome Oscillator shows a slight bearish bias, remaining below zero.
Bearish momentum is further highlighted by the behavior of key moving averages. The 20-day Simple Moving Average (SMA) at 0.5736, 100-day SMA at 0.5724, and 200-day SMA at 0.5910 all suggest selling pressure is dominant. The 10-day EMA at 0.5721 and 30-day SMA at 0.5733 confirm that the pair is currently trading below important resistance zones.
Immediate support is seen near 0.5692, with further downside targets around 0.5660 if sellers regain control. On the flip side, resistance is noted at 0.5700, followed by 0.5708 and 0.5718, where prior highs and moving averages converge. A sustained break above this area would be needed to shift the short-term bias toward the upside.
