Gold vs. US dollar; Comatose vs. 3rd '50-DMA' rejection
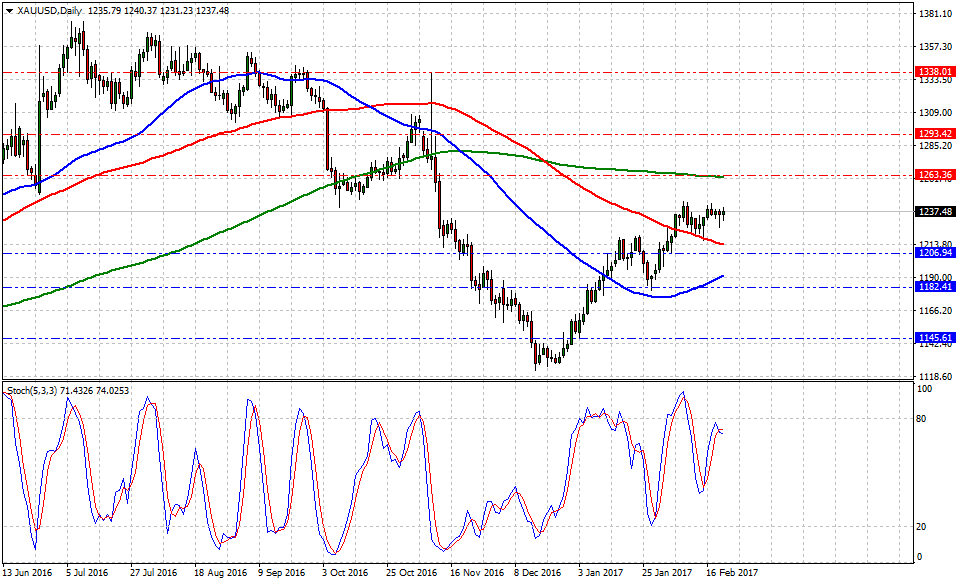
Currently, the Gold spot is trading at 1236.89, marginally up +0.07% or 84-pips on the day, having posted a daily high at 1240.61 and low at 1231.23. On the other hand, the US 10yr treasury yields have traded from 2.45% to 2.38%, down -0.37% on the day at 2.42% or -0.0089.
The last 12-consecutive trading sessions have been fairly predictable for the 'shiny metal' as traders and investors experience limited volatility and lack of direction in the asset. Furthermore, today's FOMC minutes failed to deliver clarity as of 'when' or 'if' in March the Federal Reserve could hike rates. Hence, 'faily soon' was the wording and rhetoric on the document.
Nevertheless, political tension should not be ruled out as there are multiple wars on the horizon: US-China Trade War, Currency Wars (ongoing), NAFTA War, and Germanys euro preservation battle. All of them, qualified catalysts to boost long-gold positions to hedge market risk and wealth protection.
Gold could re-test $1,261.18 – Commerzbank
Historical data available for traders and investors indicates during the last 8-weeks that Gold spot had the best trading day at +1.41% (Jan.5) or 1664-pips, and the worst at -1.11% (Jan.18) or (1331)-pips.
Technical levels to watch
In terms of technical levels, upside barriers are aligned at $1262 (200-DMA), then at 1290 (high Nov.10) and above that at $1330 (high Nov.9). While supports are aligned at $1206 (low Feb.3), later at $1189 (50-DMA) and below that at $1140 (low Jan.3). On the other hand, Stochastic Oscillator (5,3,3) seems to slightly change direction to head north. Therefore, there is evidence to expect further Gold gains in the near term.
The greenback – gauged by the US Dollar Index seems muted 'at 50-DMA gates' which contributed to a sell-off across the board (this represents the 3rd attempt during the last 6 trading sessions). However, the bullish tone hasn't been diluted as long as the buck holds 100.20 handle. Now, there is technical evidence to expect either a break above 101.60 or sell-off towards the 100-DMA near 100.24.
In term of technical levels, upside barriers are aligned at 101.74 (high Feb.15), then at 102.48 (high Jan.9) and above that at 103.20 (high Dec.23). Meanwhile, supports are aligned at 99.96 (100-DMA), later at 98.54 (low Nov.11) and finally below that at 97.54 (low No.8).
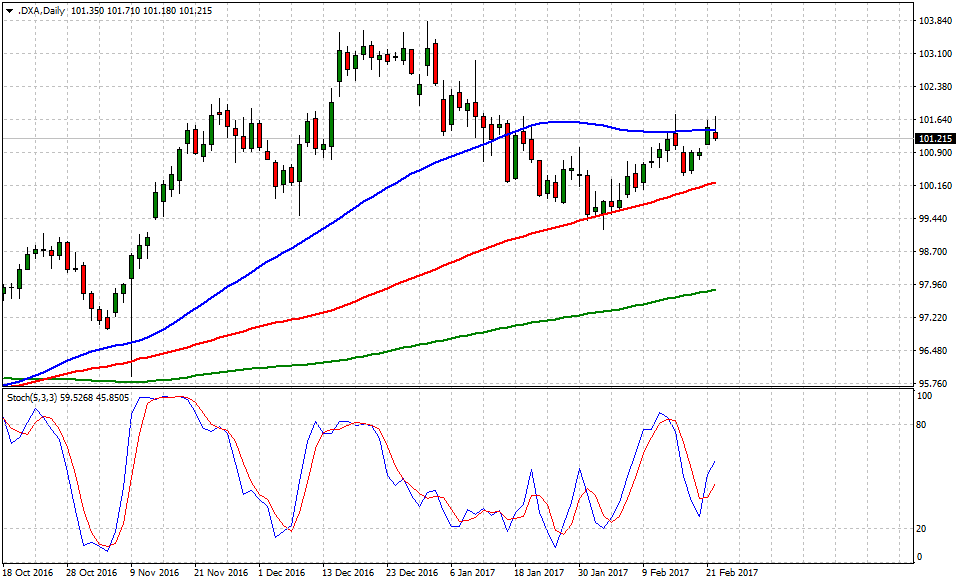
US dollar index erases gains after Fed’s minutes