USD/CAD Technical Analysis: USD/CAD finds support at 1.3000 the figure
- USD/CAD is trying to stabilize above the 1.3000 figure. USD/CAD bulls tried to breakout above the 1.3120 resistance on Wednesday but the market seems enclined to stay in trading range mode for the time being.
- USD/CAD is essentially in a bearish pullback and has found support at the 100-daily simple moving average this week.
- Bulls objective is to breakout above the 1.3120-1.3155 area in order to resume the main bull trend.
- On the flip side bears want a breakout below 1.2974 August 1 swing low in order to transform the current bearish pullback into a bearish reversal.
USD/CAD 15-minute chart
-636694241369667476.png)
USD/CAD daily chart
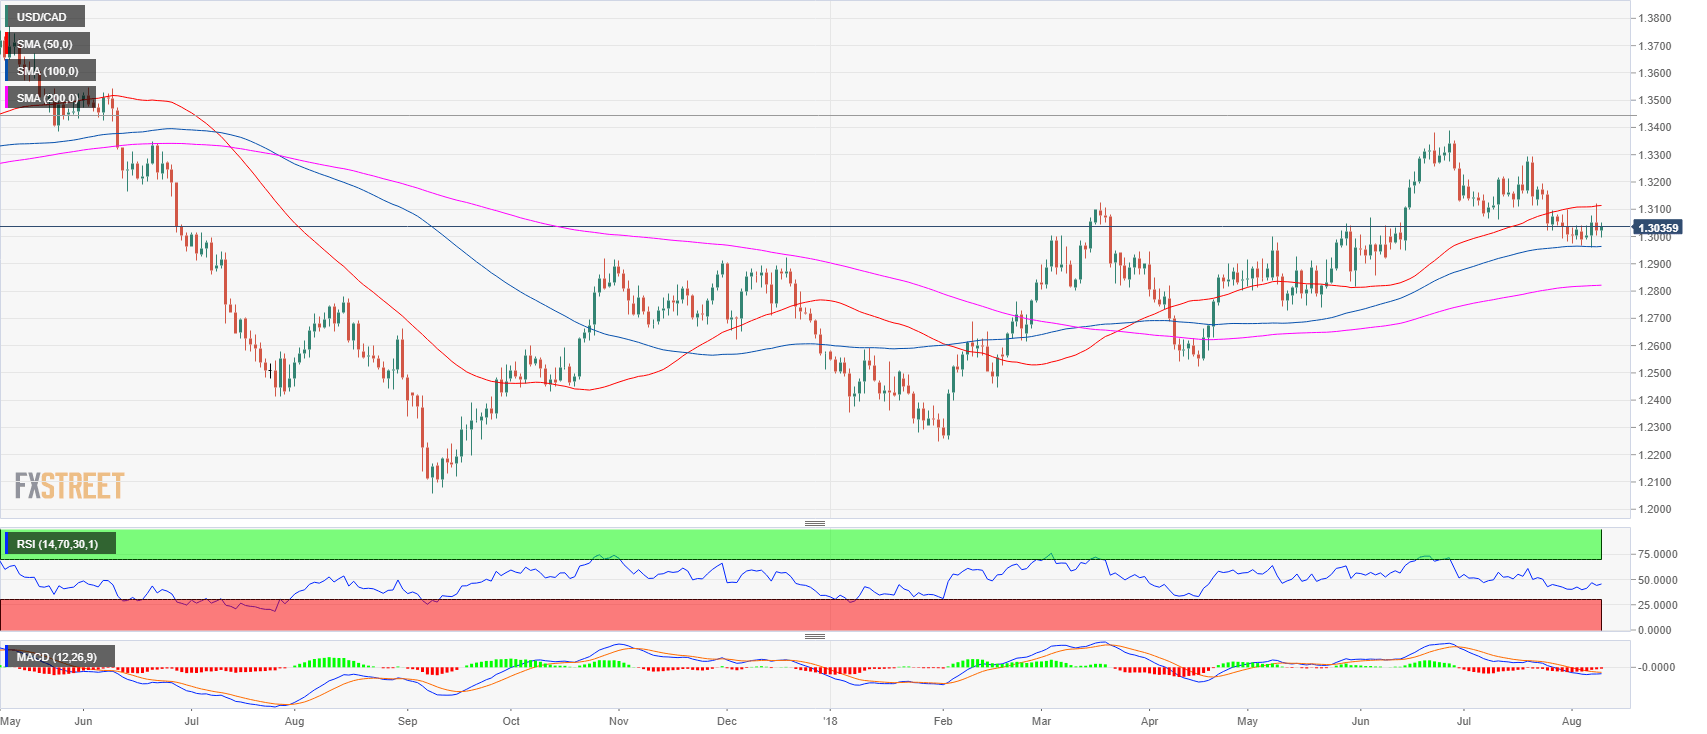
Spot rate: 1.3035
Relative change: 0.10%
High: 1.3050
Low: 1.2997
Trend: Bullish / Bearish correction
Resistance 1: 1.3053-1.3066 area, June 5 swing high and July 9 low
Resistance 2: 1.3100-1.3120 figure and supply/demand level
Resistance 3: 1.3155 June 18 low
Resistance 4: 1.3200 figure
Resistance 5: 1.3271 June 29 high
Resistance 6: 1.3350 figure
Resistance 7: 1.3388, 2018 high
Resistance 8: 1.3543 June 9, 2017 swing high
Support 1: 1.3022 July 25 low
Support 2: 1.3000 figure
Support 3: 1.2974 August 1 swing low
Support 4: 1.2900 figure
Support 5: 1.2855 June 6 low