Back
11 Sep 2018
AUD/JPY Technical Analysis: Building up for corrective rally
- The AUD/JPY has charted a bullish divergence and a higher high on the hourly chart, indicating the stage is set for a corrective rally. However, the positive move is seen gathering pace above the descending trendline hurdle, currently located at 79.48.
- A move through the falling trendline would open up upside towards 80.00 (psychological hurdle). On the downside, acceptance below the support at 78.75 would revive the bearish view.
Hourly Chart
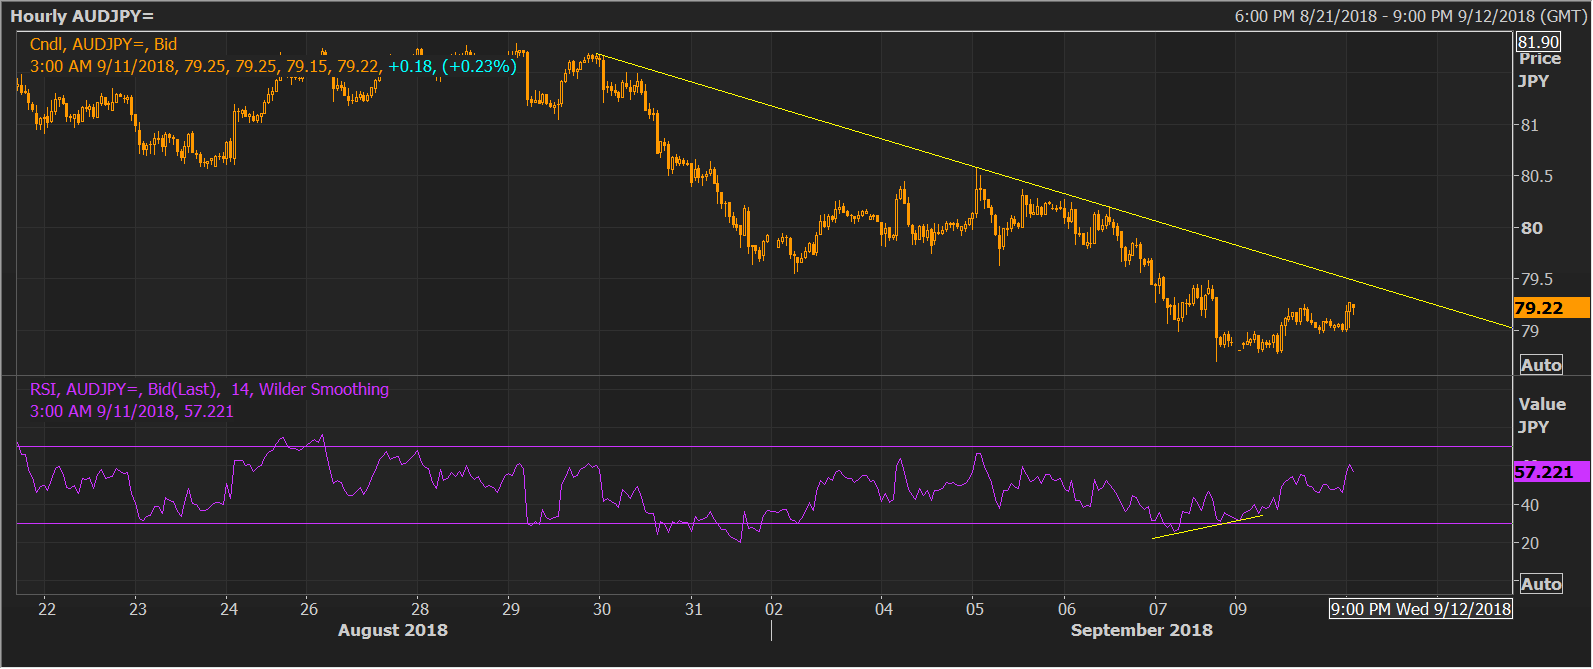
Spot Rate: 78.19
Daily High: 79.28
Daily Low: 78.99
Trend: Bullish
Resistance
R1: 79.52 (Sep. 3 low)
R2: 79.91 (downward sloping 10-day moving average)
R3: 80.00 (psychological hurdle)
Support
S1: 78.99 (session low)
S2: 78.68 (Sep. 7 low)
S3: 77.58 (February 2016 low)