Back
12 Sep 2018
EUR/GBP Technical Analysis: 50-hour MA is proving a tough nut to crack
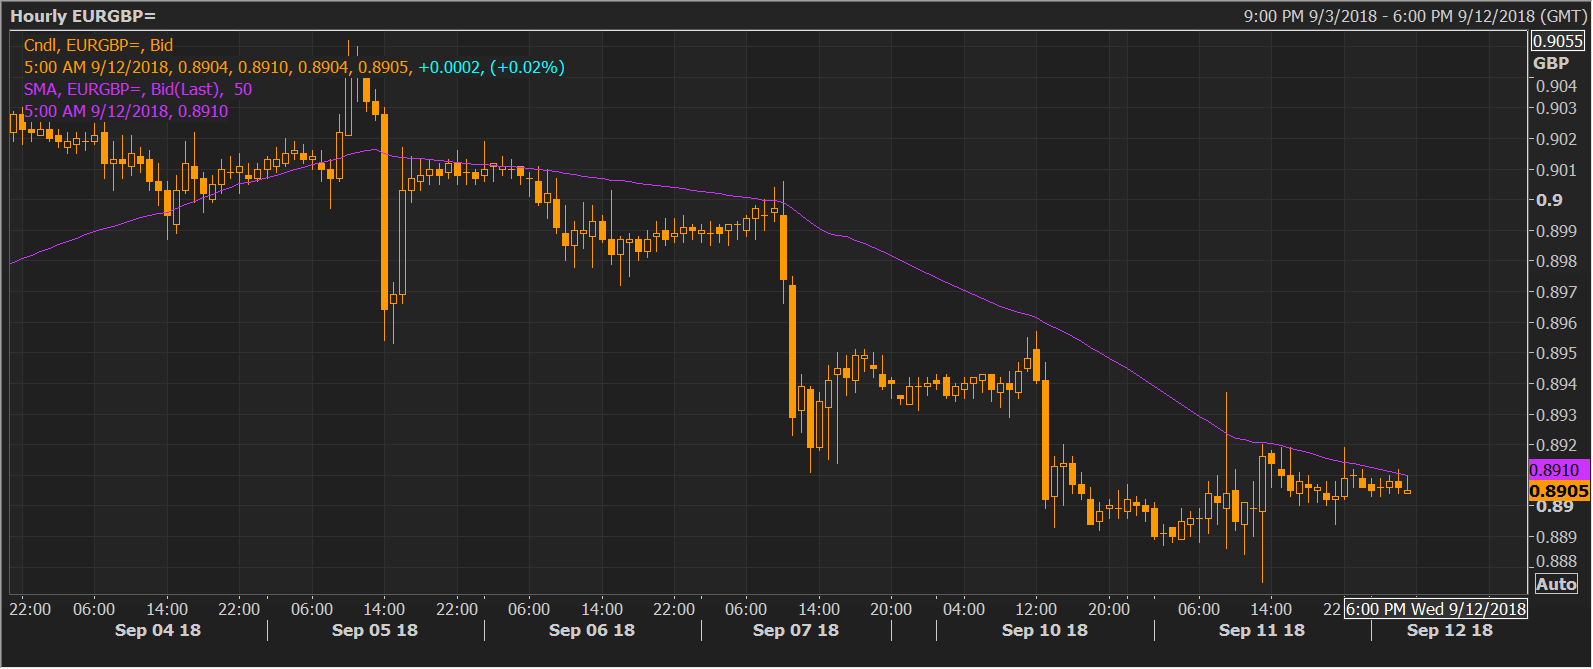
- The bullish divergence of the hourly chart relative strength index (RSI) has set the stage for a notable corrective rally toward the 10-day moving average (MA), however, the downward (bearish) sloping 50-hour MA is capping gains.
- Acceptance above the 50-hour MA could set the tone for a stronger corrective rally, however, the gains will likely be short-lived as the head-and-shoulders breakdown witnessed on Sep. 7 turned the tide in favor of the bears. Further, the 5-day and 10-day MAs are trending south in favor of the bears.
Hourly chart

Spot Rate: 0.8905
Daily High: 0.8915
Daily Low: 0.8902
Trend: Intraday bullish above 50-hour MA
Resistance
R1: 0.8911 (50-hour MA)
R2: 0.8932 (50-day MA)
R3: 0.8960 (10-day MA)
Support
S1: 0.89 (psychological support)
S2: 0.8876 (previous day's low)
S3: 0.8859 (trendline sloping north from the April 17 low)
