Back
16 Nov 2018
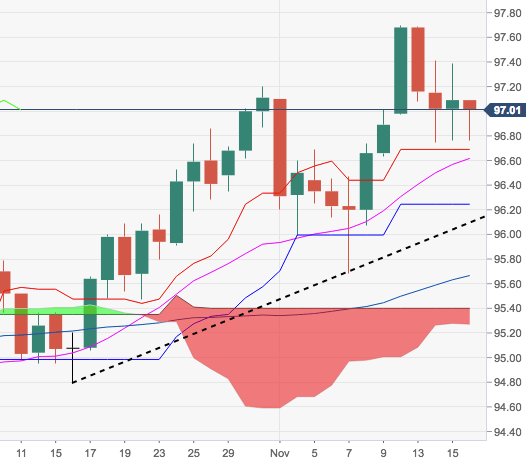
DXY Technical Analysis: The price action around the greenback remains choppy. DXY stays supported near 96.80
- The index is prolonging the choppy trade so far this week and continues to navigate the 97.00 neighbourhood with moderate support in the 96.80 area, where converges the 10-day SMA.
- In case the selling impetus picks up pace, the 21-day SMA at 96.60 should offer interim contention ahead of the more relevant 95.68, monthly lows so far.
- Furthermore, the constructive bias is poised to persists as long as the short-term support line at 96.09 holds.
DXY daily chart
Dollar Index Spot
Overview:
Last Price: 97
Daily change: -9.0 pips
Daily change: -0.0927%
Daily Open: 97.09
Trends:
Daily SMA20: 96.6
Daily SMA50: 95.68
Daily SMA100: 95.36
Daily SMA200: 93.5
Levels:
Daily High: 97.39
Daily Low: 96.76
Weekly High: 97.01
Weekly Low: 95.68
Monthly High: 97.2
Monthly Low: 94.79
Daily Fibonacci 38.2%: 97.15
Daily Fibonacci 61.8%: 97
Daily Pivot Point S1: 96.77
Daily Pivot Point S2: 96.45
Daily Pivot Point S3: 96.14
Daily Pivot Point R1: 97.4
Daily Pivot Point R2: 97.71
Daily Pivot Point R3: 98.03