Back
6 Feb 2019
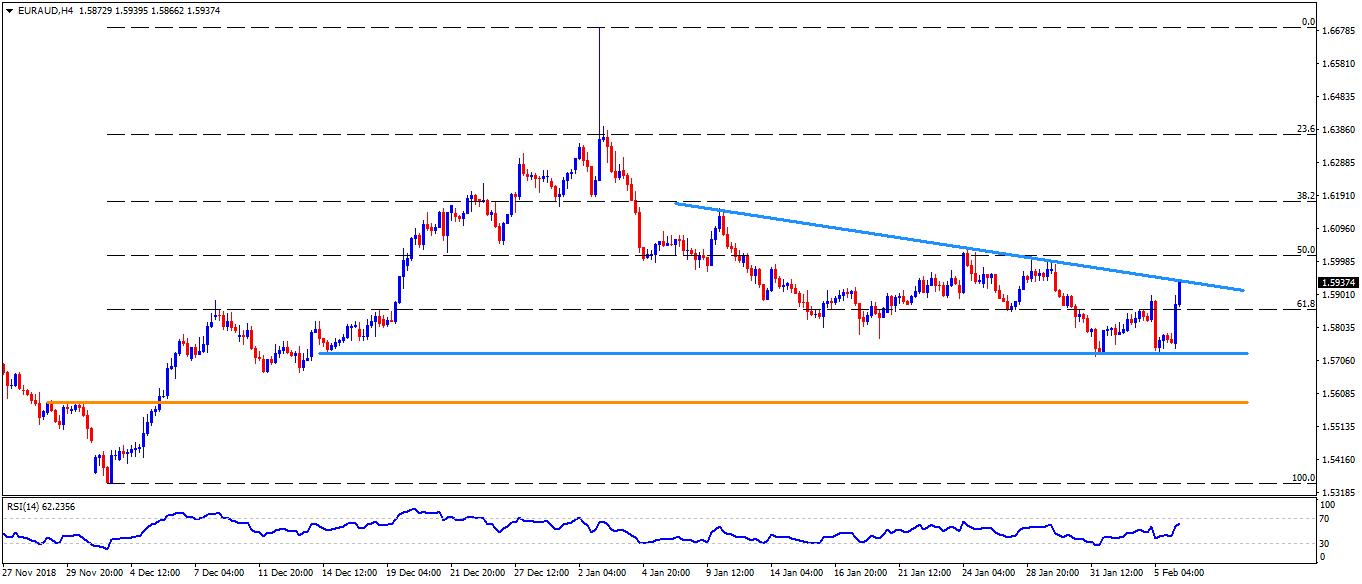
EUR/AUD Technical Analysis: The 1.5940 trendline resistance grabs market attention
- The EUR/AUD pair gradually rose to intraday high of 1.5937 after the RBA Governor’s speech triggered across the board Aussie weakness on Wednesday. However, the pair is yet to surpass four-week old descending resistance-line, at 1.5940 in order to justify its strength.
- Should prices rally beyond 1.5940, the 1.6000 could appear on the buyers’ radar as next challenge whereas 1.6080 and the 1.6160 might be targeted afterwards.
- Alternatively, pair’s failure to surpass immediate trend-line barrier can drag it back to 1.1.5780 prior to highlighting the 1.5730-25 horizontal-support covering recent lows.
- Given the pair’s decline beneath the 1.5725, the 1.5670 and the 1.5585-80 could become sellers’ favorites.
- It should also be noted that the 14-bar relative strength index (RSI) is near to overbought levels, indicating tough ride on the upside.
EUR/AUD 4-hour chart
EUR/AUD
Overview:
Today Last Price: 1.5939
Today Daily change: 165 pips
Today Daily change %: 1.05%
Today Daily Open: 1.5774
Trends:
Daily SMA20: 1.5894
Daily SMA50: 1.5905
Daily SMA100: 1.5945
Daily SMA200: 1.5855
Levels:
Previous Daily High: 1.5899
Previous Daily Low: 1.573
Previous Weekly High: 1.6009
Previous Weekly Low: 1.5721
Previous Monthly High: 1.6914
Previous Monthly Low: 1.5721
Daily Fibonacci 38.2%: 1.5795
Daily Fibonacci 61.8%: 1.5835
Daily Pivot Point S1: 1.5703
Daily Pivot Point S2: 1.5632
Daily Pivot Point S3: 1.5534
Daily Pivot Point R1: 1.5872
Daily Pivot Point R2: 1.597
Daily Pivot Point R3: 1.6041