Back
20 Feb 2019
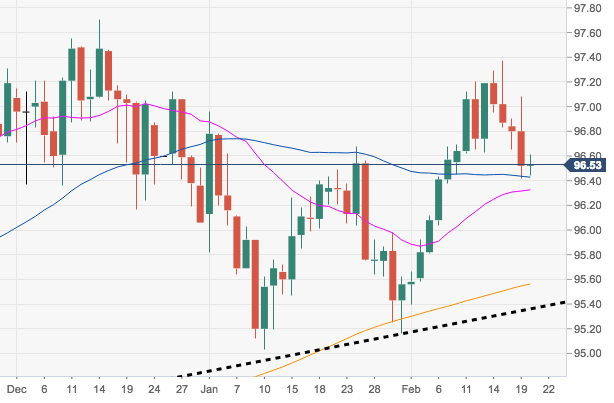
US Dollar Index Technical Analysis: The leg lower meets support in the 55-/100-day SMA near 96.40
- The index is prolonging the leg lower from last week’s YTD peaks, finding quite moderate support in the 96.40 region, where converge the 55- and the 100-day SMA.
- Further retracements are expected to face the Fibo retracement of the September-December up move at 96.22.
- In the broader picture, the constructive outlook in the buck remains unchanged while above the 200-day SMA at 95.56 and the short-term support line, today at 95.36.
DXY daily chart
Dollar Index Spot
Overview:
Today Last Price: 96.53
Today Daily change: 17 pips
Today Daily change %: 0.01%
Today Daily Open: 96.52
Trends:
Daily SMA20: 96.32
Daily SMA50: 96.39
Daily SMA100: 96.4
Daily SMA200: 95.55
Levels:
Previous Daily High: 97.08
Previous Daily Low: 96.42
Previous Weekly High: 97.37
Previous Weekly Low: 96.62
Previous Monthly High: 96.96
Previous Monthly Low: 95.03
Daily Fibonacci 38.2%: 96.67
Daily Fibonacci 61.8%: 96.83
Daily Pivot Point S1: 96.27
Daily Pivot Point S2: 96.01
Daily Pivot Point S3: 95.61
Daily Pivot Point R1: 96.93
Daily Pivot Point R2: 97.33
Daily Pivot Point R3: 97.59