Back
29 Mar 2019
GBP/USD Technical Analysis: Cable volatile on Brexit chaos
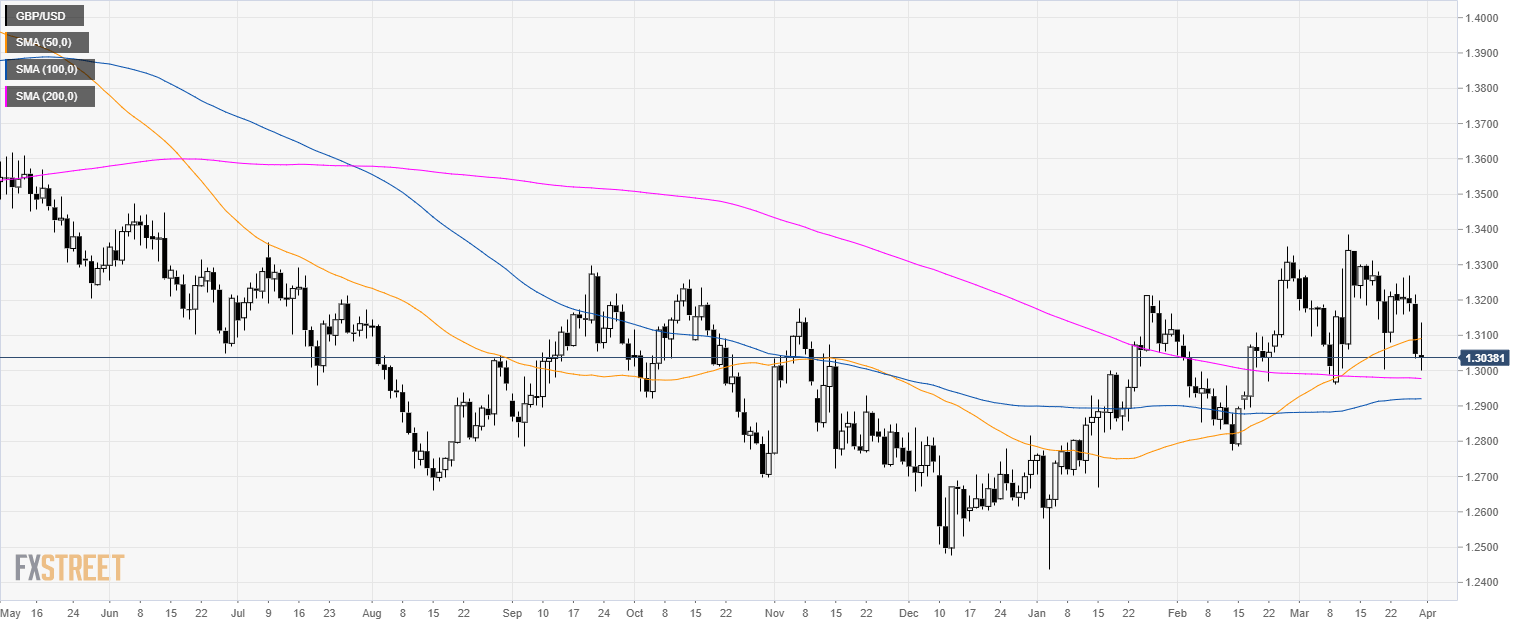
GBP/USD daily chart
- GBP/USD is trading is in consolidation mode above its 200-day simple moving average (SMAs).
- GBP/USD is very volatile as the Brexit votes are unfolding.
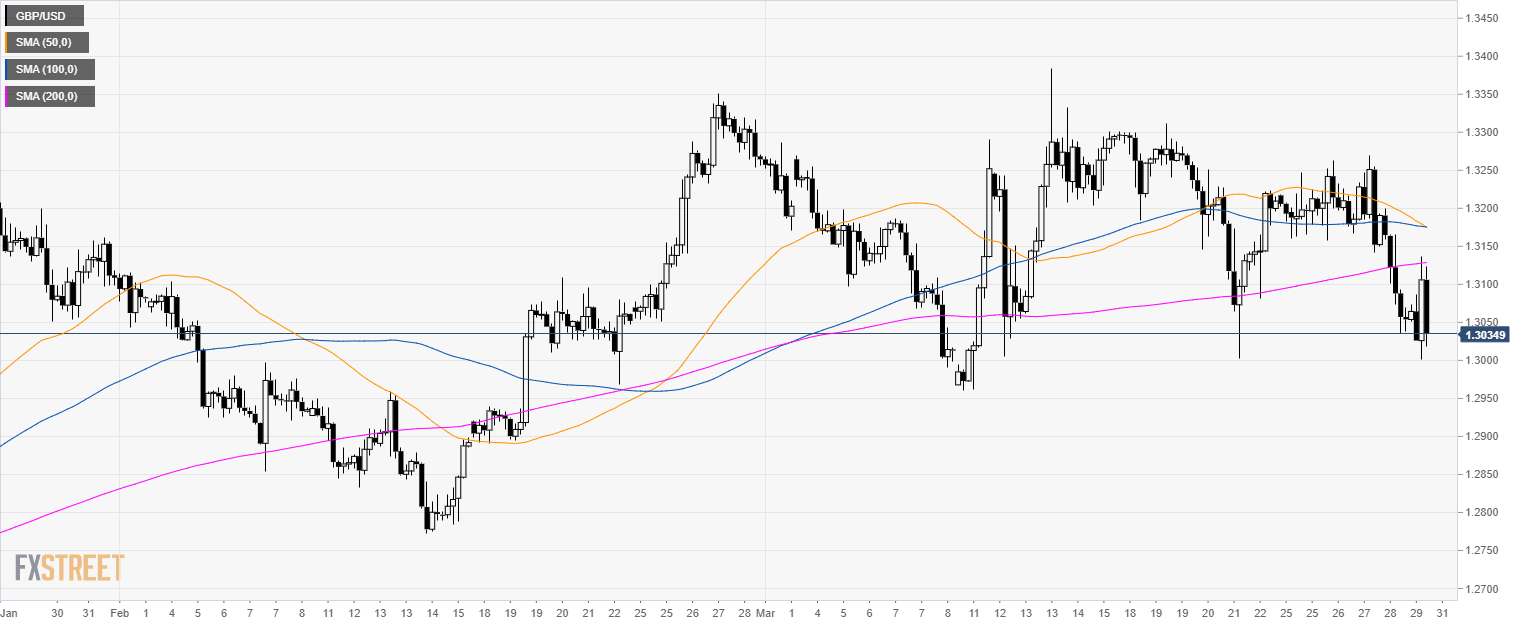
GBP/USD 4-hour chart
- GBP/USD is trading below its main SMAs suggesting a bearish momentum in the medium-term.
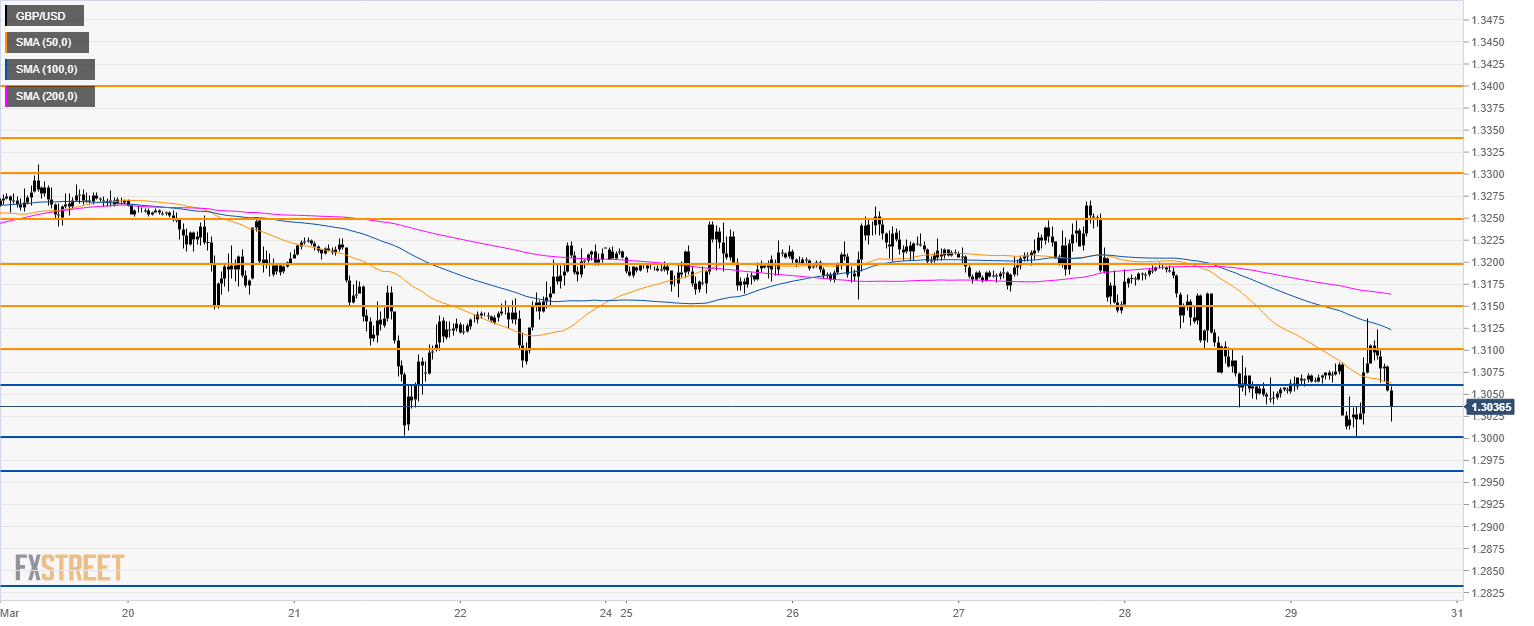
GBP/USD 30-minute chart
- GBP/USD is trading below its main SMAs suggesting a bearish momentum in the short-term.
- Key support to break for bears is 1.2965. Further down the next main support is seen at 1.2830.
- Resistance is at 1.3100 and 1.3150 level.
Additional key levels