Back
26 Jul 2019
USD/JPY technical analysis: Greenback approaching monthly highs against the Japanese Yen
- USD/JPY is nearing the monthly highs as the US Dollar is gaining strength.
- The next key resistance to the upside is at the 108.86 level.
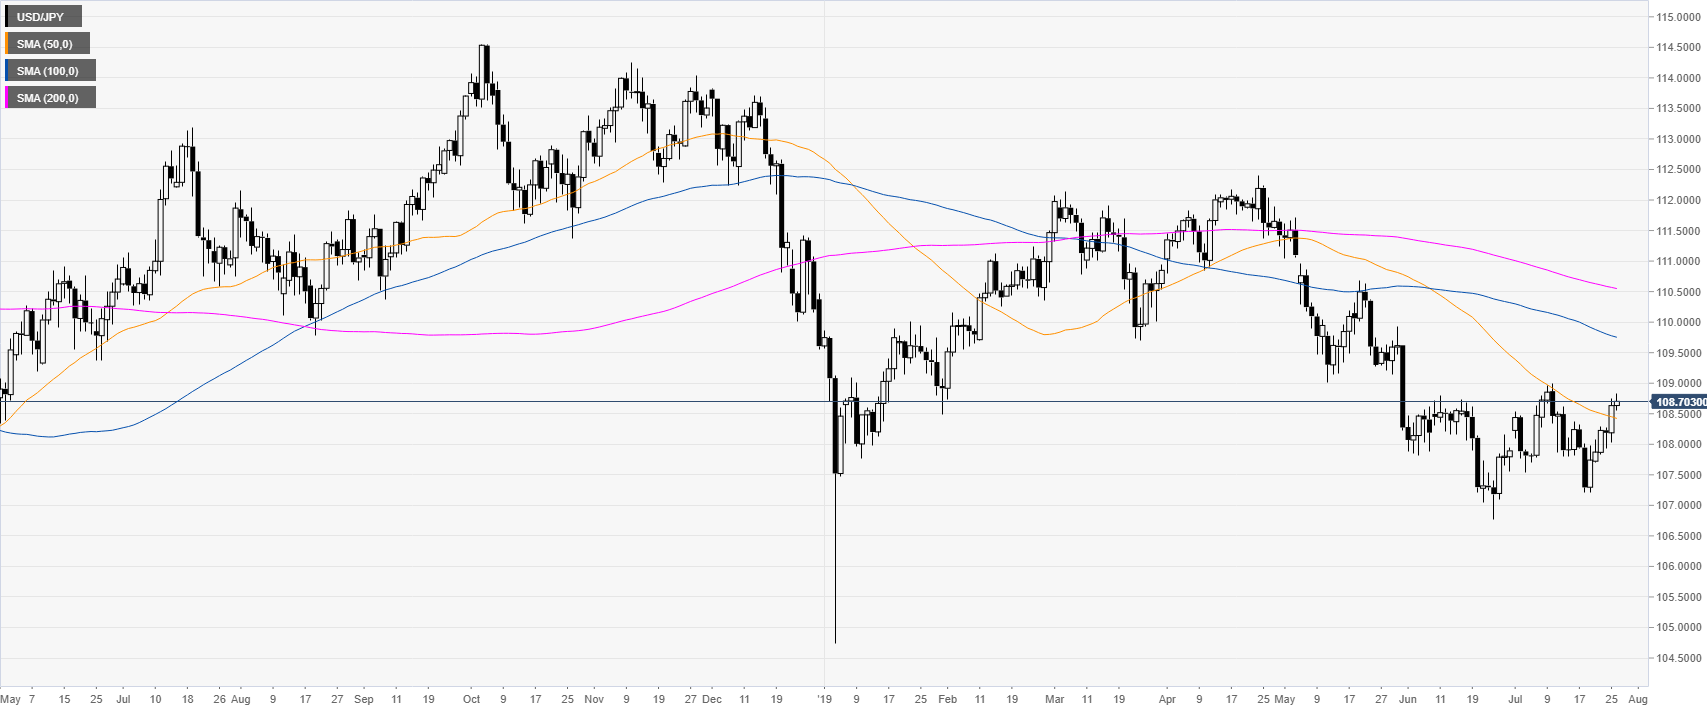
USD/JPY daily chart
USD/JPY is nearing the monthly highs as the market is challenging the 50-day simple moving average (SMA).
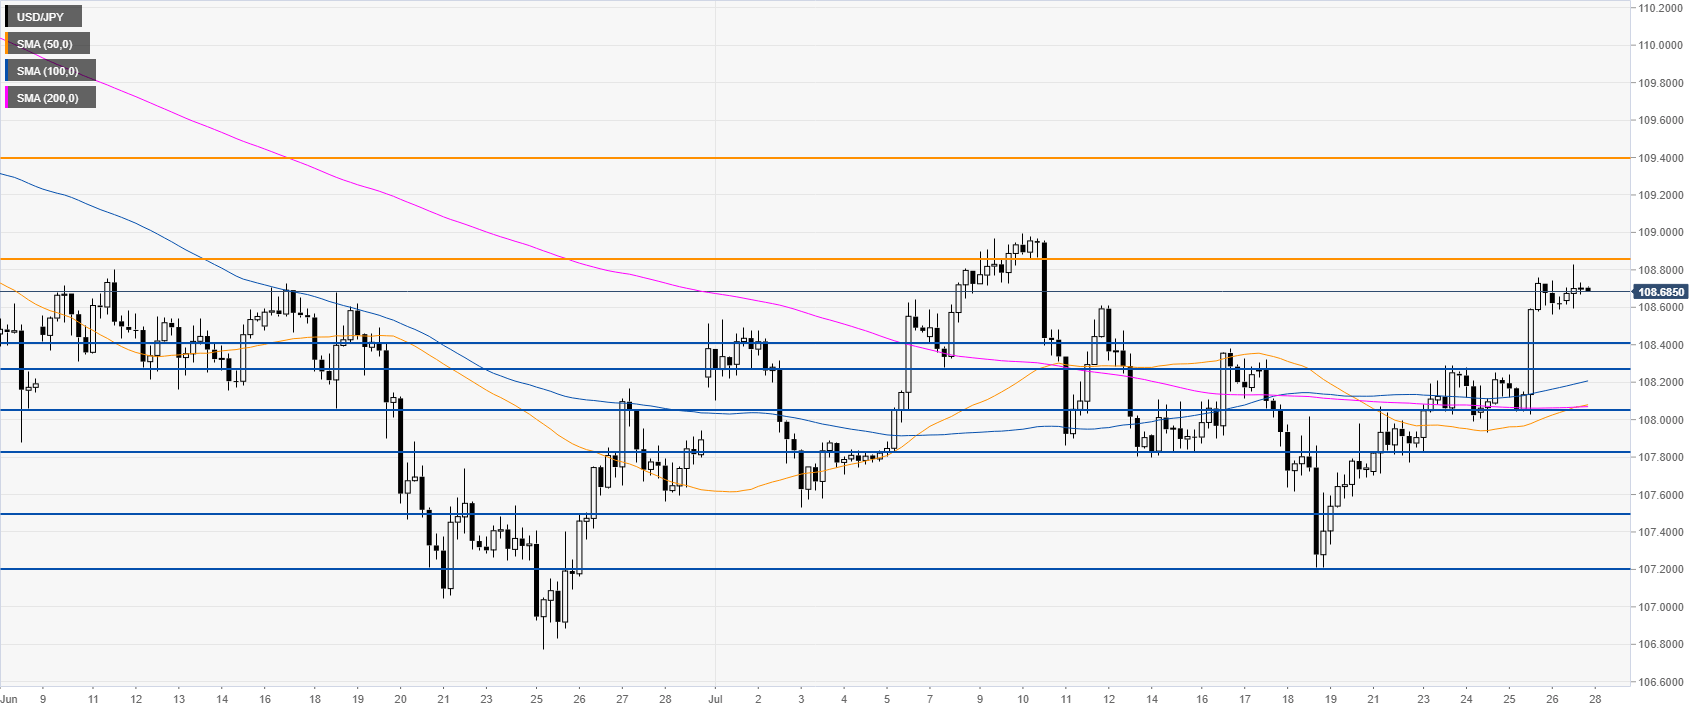
USD/JPY 4-hour chart
USD/JPY broke above 108.41 resistance and it almost reached the 108.86 resistance. A break beyond this level can open the doors to a run towards 109.40 resistance, according to the Technical Confluences Indicator.
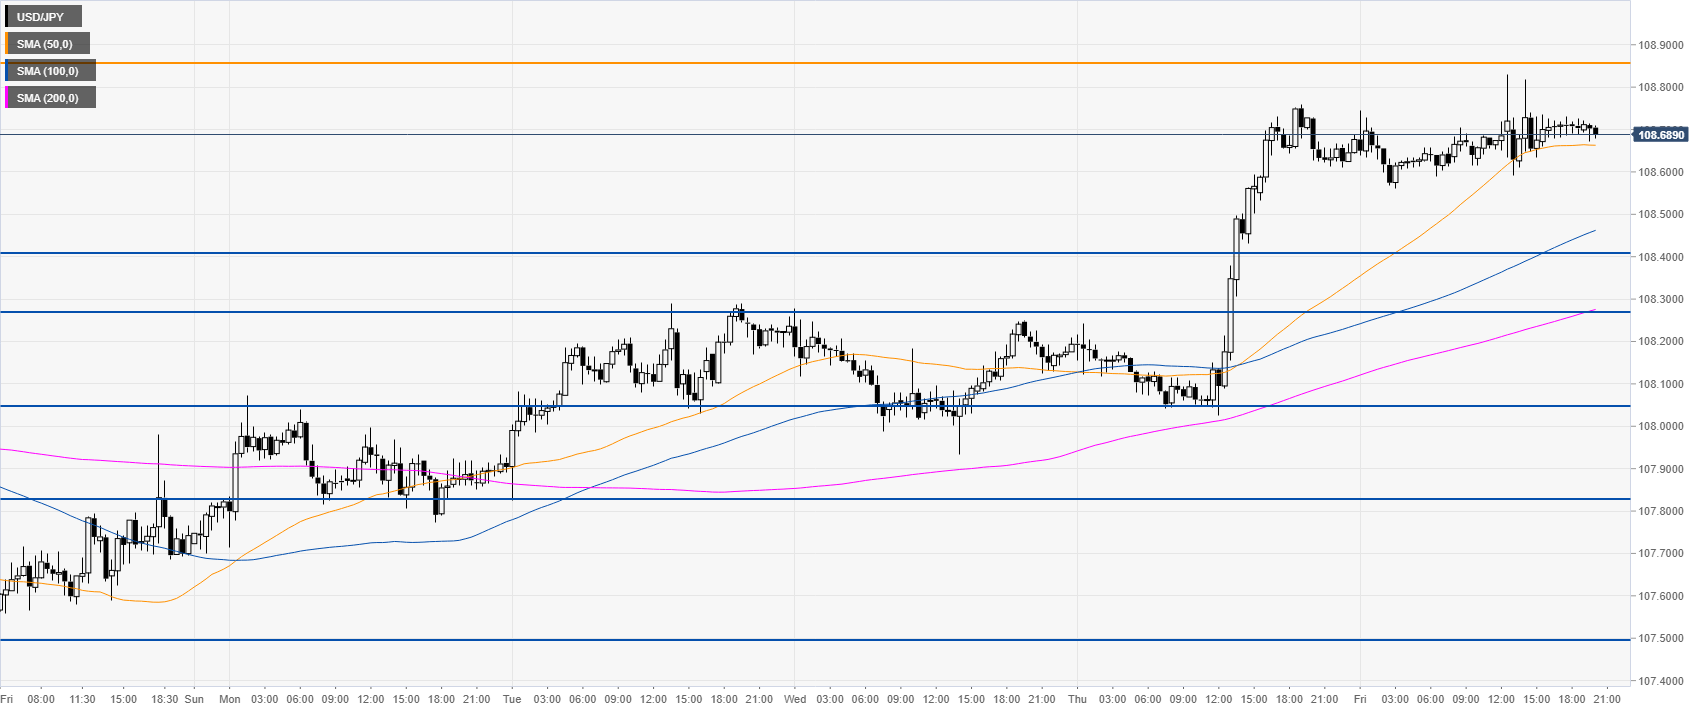
USD/JPY 30-minute chart
USD/JPY is trending above the main SMAs suggesting a bullish bias in the near term. Immediate supports can be seen at the 108.41 and the 108.03 levels, according to the Technical Confluences Indicator.
Additional key levels