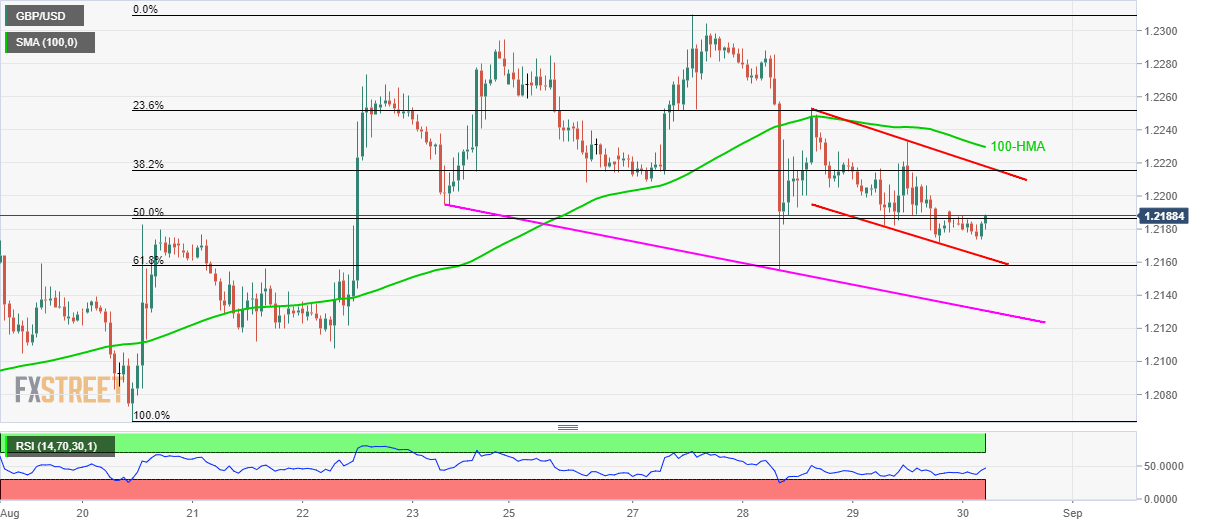
GBP/USD technical analysis: Inside falling channel below 100-HMA
- GBP/USD struggles around 50% Fibonacci retracement of August 20-27 rise.
- The two-day-old declining channel, price below 100-HMA portrays the momentum weakness.
- 61.8% Fibonacci retracement, one-week long downward sloping trend-line become the key immediate supports.
GBP/USD takes the rounds to 50% Fibonacci retracement level as it flashes 1.2188 heading into Friday’s UK open.
While immediate descending trend channel’s resistance, at 1.2220, and 100-hour moving average (HMA) level of 1.2230 are likely nearby key resistances, 23.6% Fibonacci retracement level of 1.2252 can exert downside pressure to the prices.
Given the buyers’ ability to conquer 1.2252, 1.2290 and recent high surrounding 1.2310 will appear on their watch-list.
Alternatively, one-week-old downward sloping trend-line, at 1.2130 follows channel’s support of 1.2163 and 61.8% Fibonacci retracement level of 1.2158 during the pair’s pullback.
If sellers dominate past-1.2130, August 22 low near 1.2110 and 1.2065 can please the bears.
GBP/USD hourly chart

Trend: bearish
