Back
17 Oct 2019
EUR/GBP Technical analysis: Bounces from the 0.8600 handle, trading at multi-month lows
- The DUP (Democratic Unionist Party) rejected the Brexit deal, alleviating, for now, the bullish pressure on the GBP.
- EUR/GBP is consolidating losses at multi-month lows, trading above the 0.8600 handle.
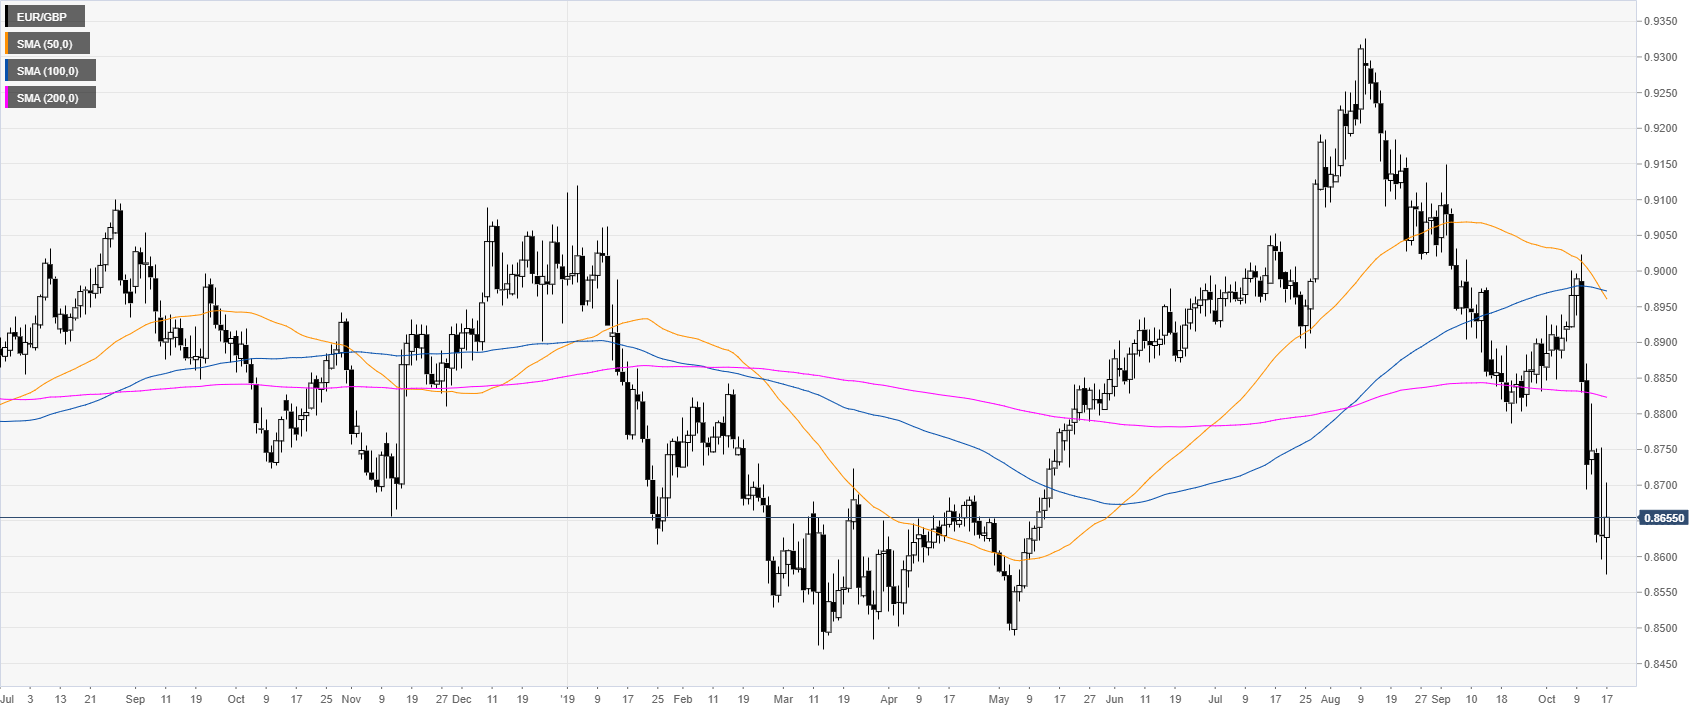
EUR/GBP daily chart
On the daily chart, EUR/GBP is trading in a bear trend below the main daily simple moving averages (DSMAs). This Thursday, the DUP (Democratic Unionist Party) rejected the Brexit deal, taming, for the time being, the bullish pressure on the GBP.
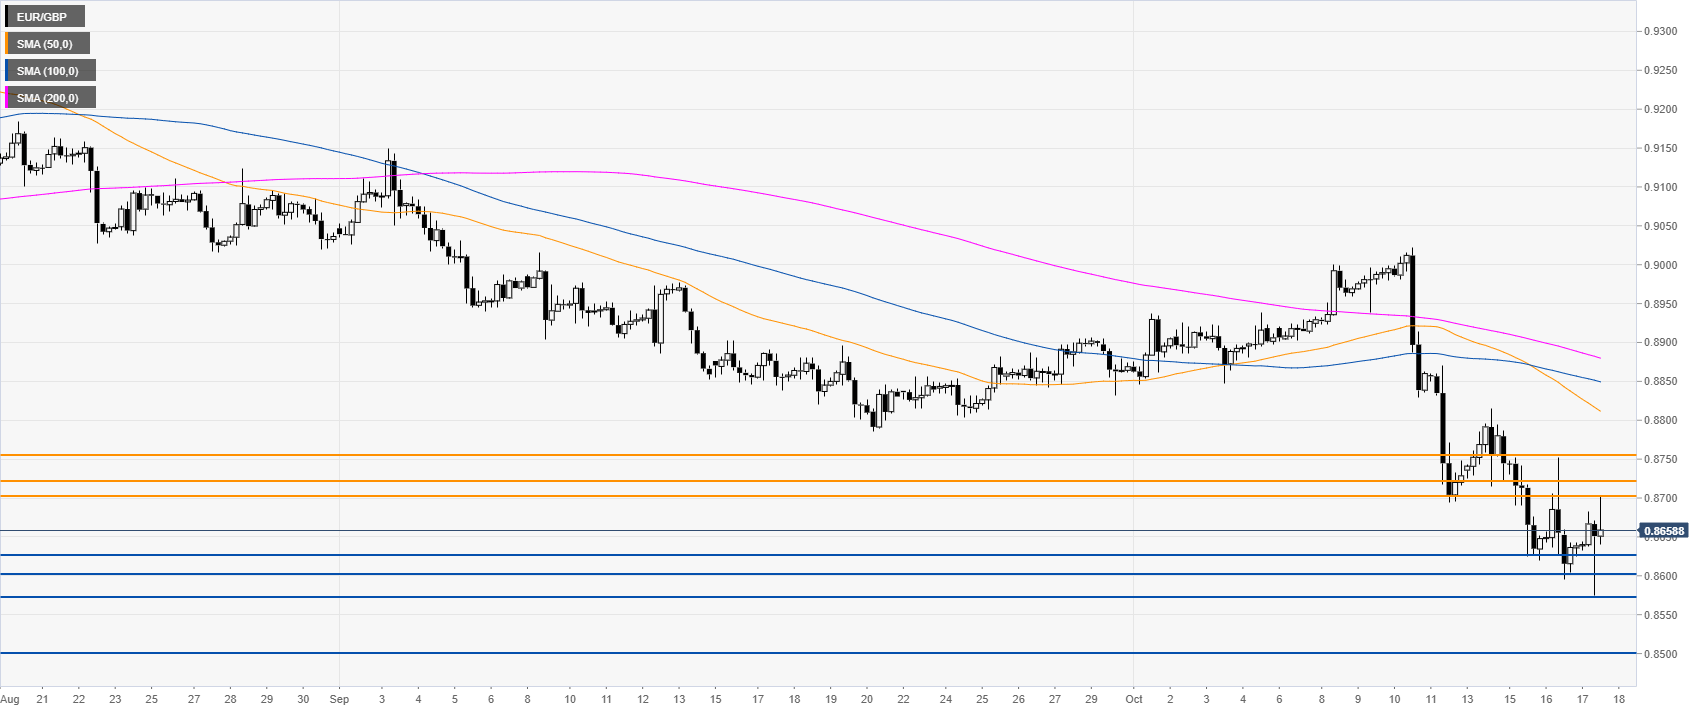
EUR/GBP four-hour chart
EUR/GBP is under bearish pressure below its main SMAs. Sellers need a daily break below the 0.8571 support in order to potentially target the 0.8500 handle on the way down.
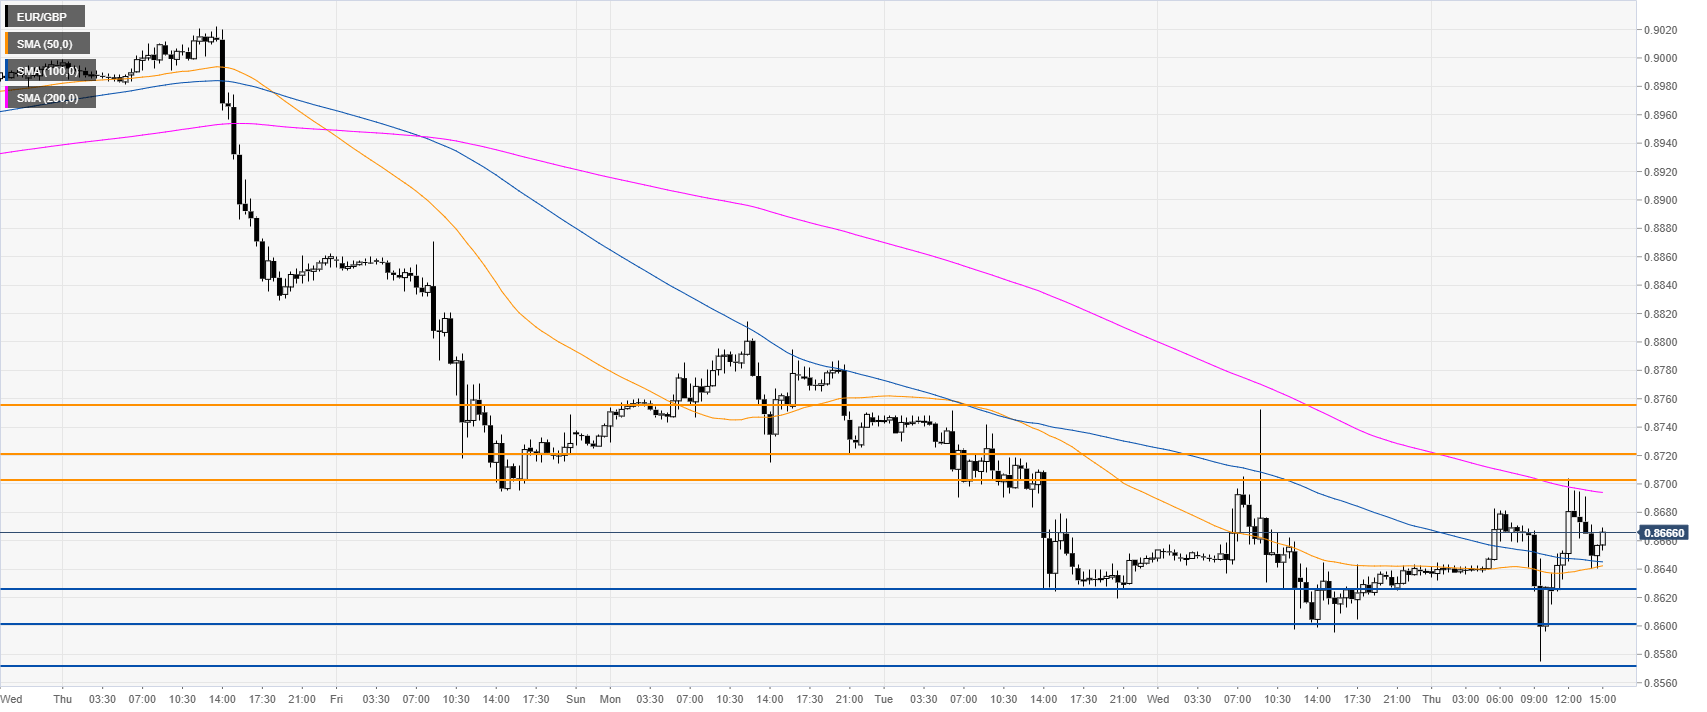
EUR/GBP 30-minute chart
EUR/GBP is trading above the 50 and 100 SMAs, suggesting a sideways market in the near term. Resistances are can be seen at 0.8700/0.8720 price zone and the 0.8755 level, according to the Technical Confluences Indicator.
Additional key levels