GBP/USD technical analysis: 1-week-old rising channel caps recent recovery
- GBP/USD stays positive above 23.6% Fibonacci retracement of a fortnight old run-up.
- The upper line of the channel restricts pair’s latest rise amid neutral RSI conditions.
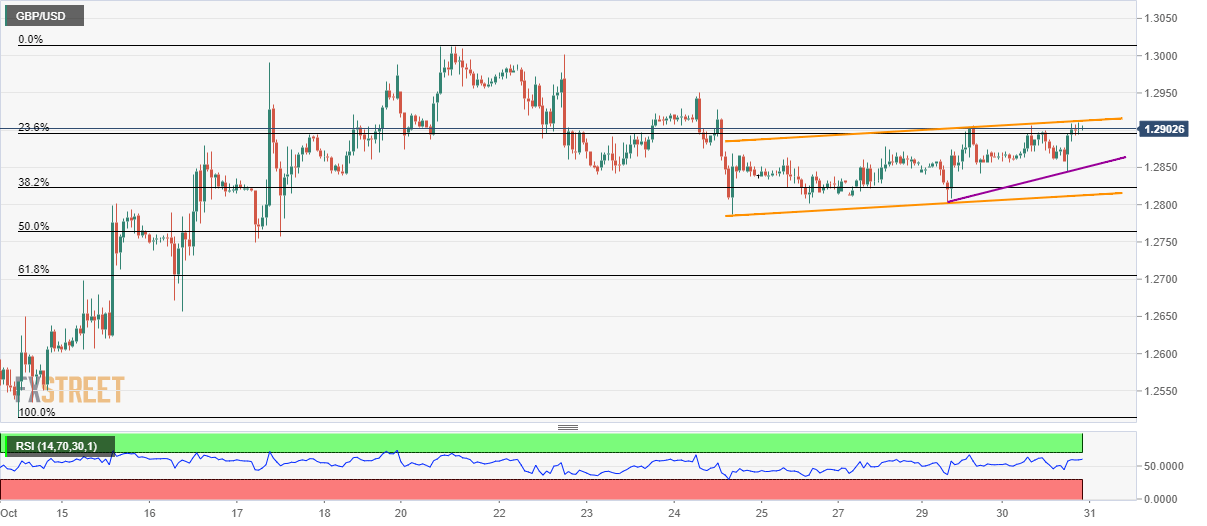
Even after rising to the highest since last Thursday, not to mention successfully crossing 23.6% Fibonacci retracement of a fortnight up-move, GBP/USD stays inside a short-term ascending channel while taking rounds to 1.2900 during the initial Asian session on Thursday.
Not only the resistance line of a one-week-old rising channel, close to 1.2915, but neutral conditions of 14-bar Relative Strength Index (RSI) also portrays buyers’ exhaustion around .2900 mark.
Though, sellers will look for a downside break of 23.6% Fibonacci retracement level at 1.2895, to aim for a two-day-old upward sloping trend line, at 1.2850.
In case prices decline below 1.2850, support line of the channel, at 1.2813, will be the key as it holds the gate for fresh declines to 1.2750 and 61.8% Fibonacci retracement level of 1.2705.
Meanwhile, pair’s further recovery beyond the channel’s resistance of 1.2915 will push buyers towards 1.2950, 1.3000 and 1.3015 consecutive upside barriers ahead of targeting May month high near 1.3180.
GBP/USD hourly chart
Trend: pullback expected