Gold Technical Analysis: Follows monthly range, 21/50-day SMA cap immediate upside
- Gold seesaws near 38.2% Fibonacci retracement of July-September upside.
- $1,535 could question buyers during major upside while $1,455 seems to please bears on the declines below range support.
- Technical indicators also favor a choppy session ahead.
Ever since the bullion’s bounce during early October, Gold keeps trading in the $45 range. The yellow metal takes the rounds to $1,491 by the press time of the pre-European session on Thursday.
Prices head towards 21-day Simple Moving Average (SMA) level of $1,494 during further recovery while a 50-day SMA level of $1,502 could entertain buyers ahead of the range resistance close to $1,520.
Meanwhile, $1,480 could be considered as immediate support prior to the range’s lower end of $1,475.
The late-September high around $1,535 and early October low near $1,455 could come back on the chart depending upon the direction of the breakout.
Technical indicators like the 14-bar Relative Strength Index (RSI) and 12-bar Moving Average Convergence and Divergence (MACD) portray tepid momentum.
Gold daily chart
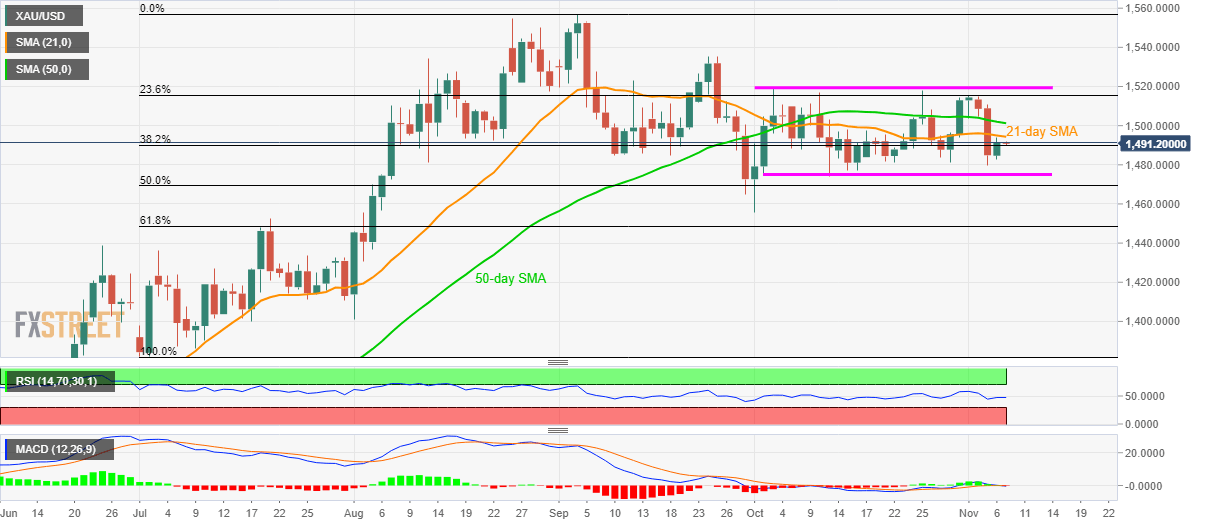
Trend: sideways