Back
3 Dec 2019
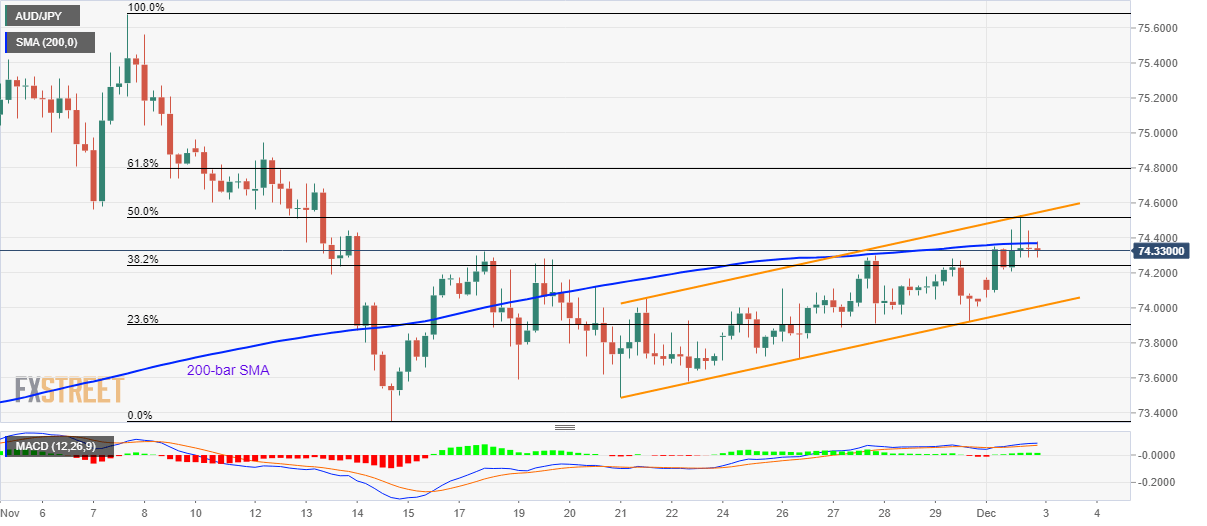
AUD/JPY Technical Analysis: Below 200-bar SMA inside short-term rising channel
- AUD/JPY drops from three weeks’ high.
- An eight-day-old rising trend channel keeps buyers hopeful.
- 50% Fibonacci retracement, channel’s upper line adds to the resistance beyond 200-bar SMA.
AUD/JPY takes a U-turn from immediate rising channel and declines below 200-bar Simple Moving Average (SMA) as the quote flashes 74.30 mark during the early Asian session on Tuesday.
Prices are likely extending the pullback towards the eight-day-old channel’s support, at 74.00, a break of which could please sellers with November 21 low near 73.50 and mid-November bottom close to 73.35.
Meanwhile, pair’s run-up beyond 200-bar SMA, at 74.37 now, will confront 50% Fibonacci retracement level of November month fall, at 74.52, followed by the channel’s resistance line, at 74.55.
Given the bull’s dominance beyond 74.55, highs marked during November 10 and 12 around 74.95/75.00 will be in focus.
AUD/JPY 4-hour chart
Trend: Pullback expected