EUR/USD Technical Analysis: Five-month-old falling trendline questions break of 100-day EMA
- EUR/USD traders above 100-day EMA for the first time since early-November.
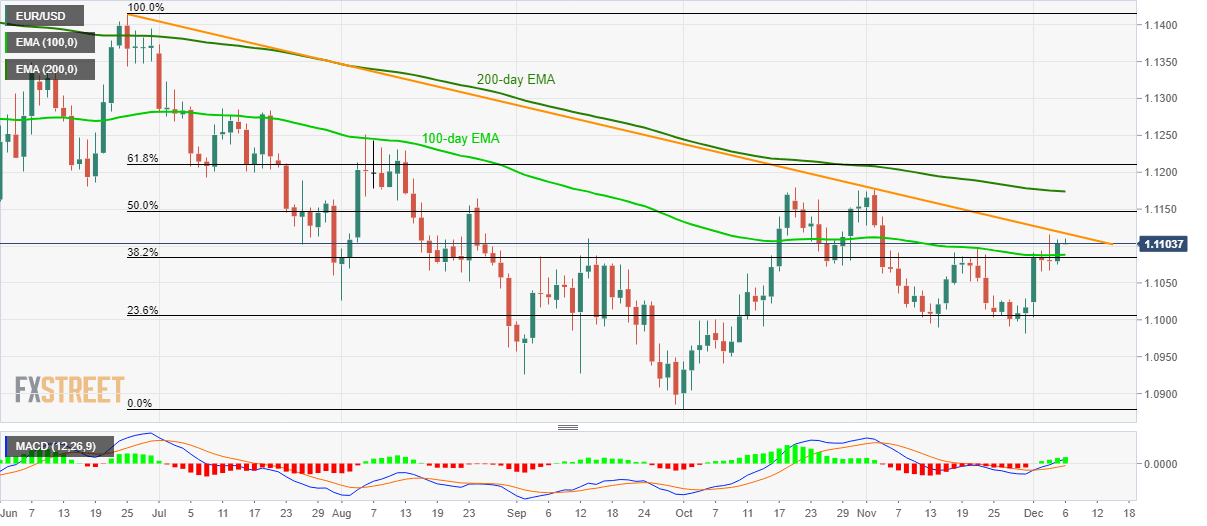
- Buyers look for entry beyond a medium-term long falling resistance line.
- 38.2% Fibonacci adds to the immediate support that holds the gate for fresh declines.
EUR/USD trades with modest gains to 1.1100 during early Friday in Asia. In doing so, the pair remains beyond 100-day Exponential Moving Average (EMA) for the first time in a month amid a bullish signal from 12-bar Moving Average Convergence and Divergence (MACD).
Even so, a downward sloping trend line since June 25, near 1.1120, limits the pair’s immediate upside. Should buyers manage to cross 1.1120, 50% Fibonacci retracement of June-October fall around 1.1150 and a 200-day EMA level of 1.1175 will be their favorites.
Meanwhile, sellers will look for entry below 1.1085/80 support confluence, including 100-day EMA and 38.2% Fibonacci retracement, to target 1.1030/25 multiple support zone.
If prices keep trading southwards after 1.1025, the previous month low near 1.0980 holds the key to September bottom around 1.0925.
EUR/USD daily chart
Trend: Pullback expected