Back
9 Jan 2020
US Dollar Index Price Analysis: DXY grinds up to the 97.55 level
- DXY is ending the New York’s session below the 97.55 resistance.
- Support is seen at the 97.20 level.
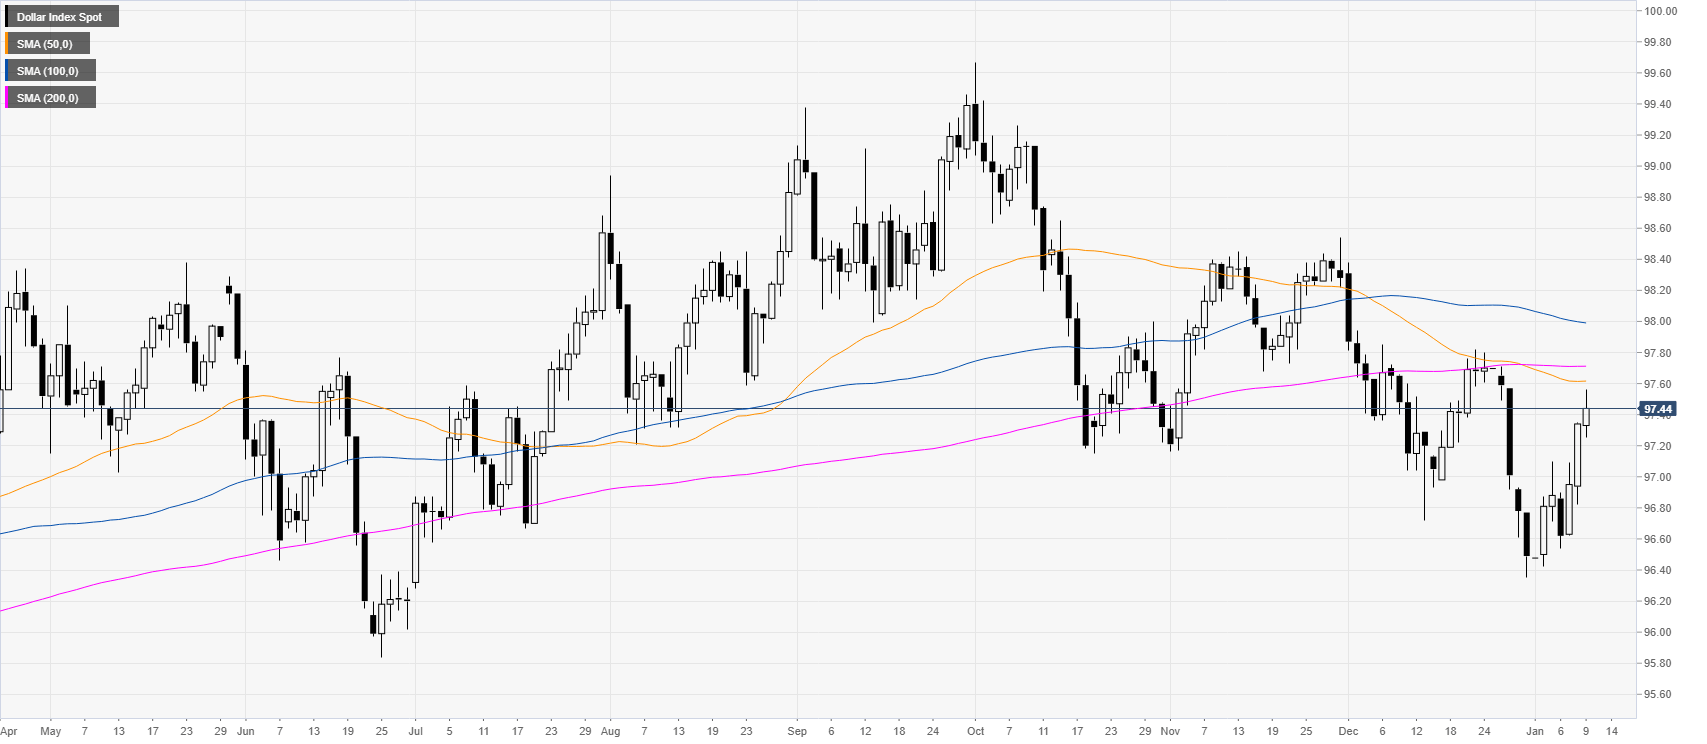
DXY daily chart
The greenback is trimming parts of the December losses as it is trading below the main daily simple moving averages (SMAs). This Thursday, DXY is grinding higher capitalizing on the bullish momentum of the last two days.
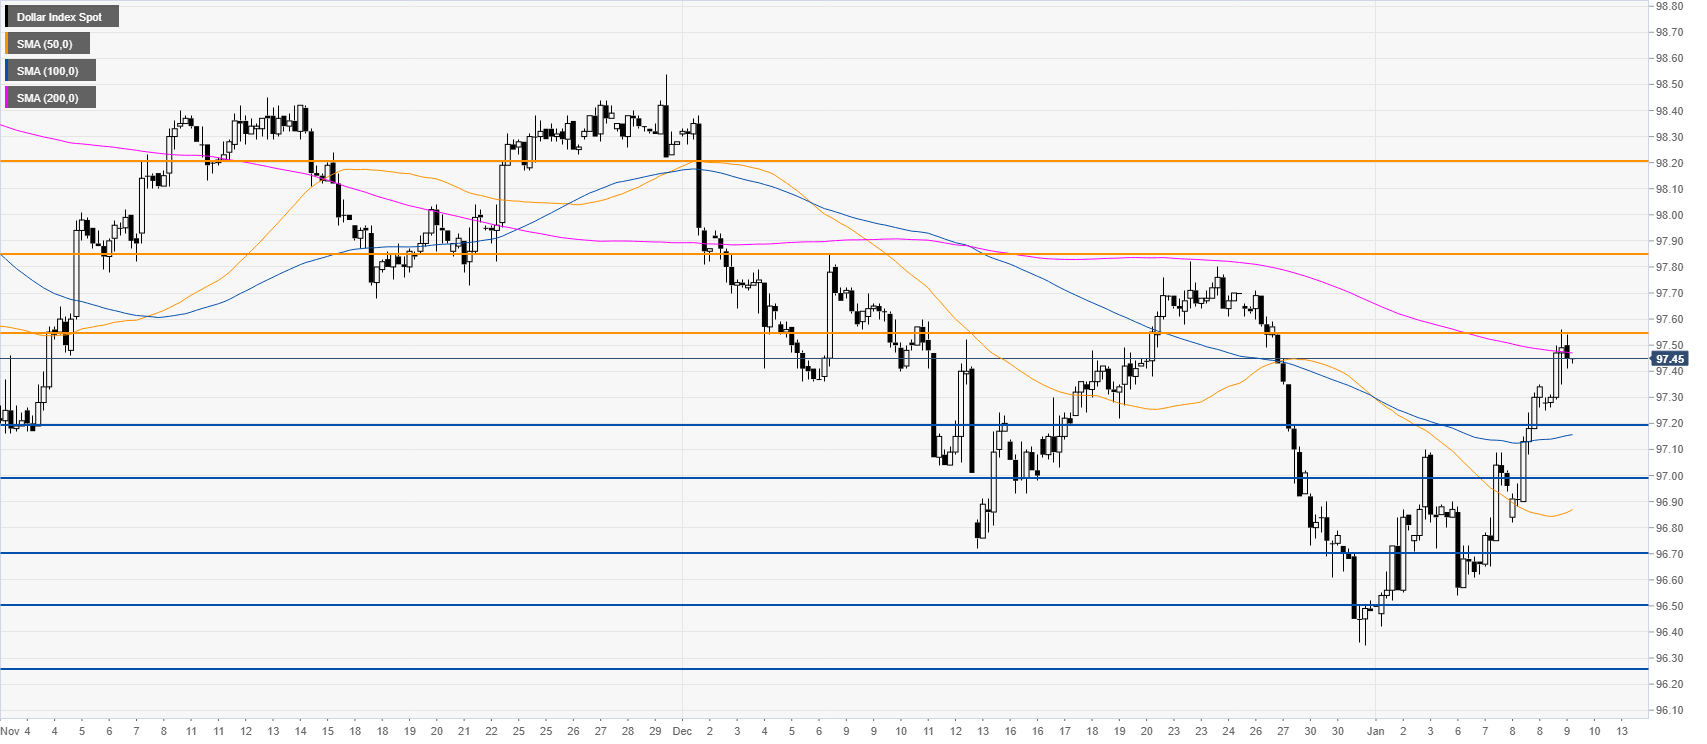
DXY four-hour chart
As expected, DXY is challenging the 97.55 resistance near the 200 SMA on the four-hour chart. The bias remains bullish however, the market could pullback down to the 97.20 level before potentially having another leg up to 97.85 and 98.20 resistances. On the flip side, a break below 97.20 could see 97.00 and 96.70 support challenged.
Additional key level