WTI Price Analysis: Clears 50/100-HMAs to regain $25.00, focus on $26.70
- WTI extends the recovery gains above short-term key resistance.
- A seven-day-old falling trend line, 38.2% Fibonacci retracement add barriers to further upside.
- 23.6% Fibonacci retracement offers an additional filter to the fresh declines.
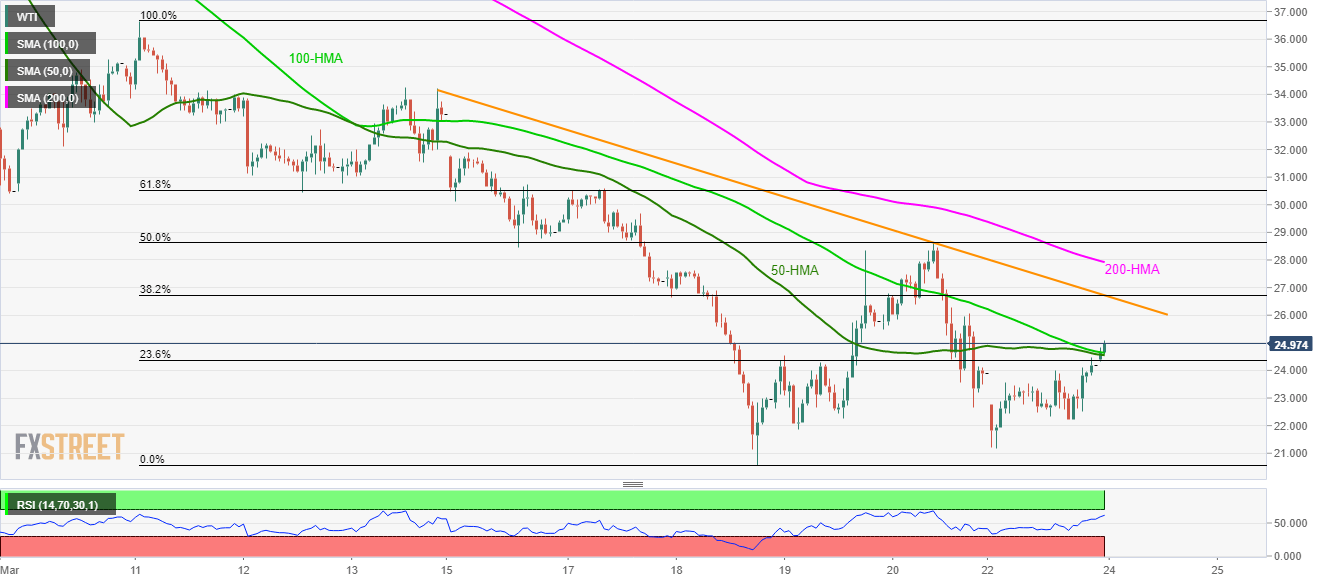
While taking rounds to $25.00, WTI manages to extend recovery gains beyond 23.6% Fibonacci retracement of March 11-18 fall as well as 50 and 100-HMAs during Tuesday’s Asian session.
As a result, the black gold now signals readiness to challenge short-term falling trend line and 38.2% Fibonacci retracement near $26.70, a break of which could push buyers towards 200-Hour Simple Moving Average (HMA) level of 27.92.
In a case where the bulls manage to stay positive above $27.962, 61.8% Fibonacci retracement near $30.55 will be on their radars.
Alternatively, a 23.6% Fibonacci retracement level near $24.35 will validate the energy benchmark’s downside below the short-term key HMA confluence around $24.60.
Should there be a sustained downside past-$24.35, $22.00 and $21.20 will regain the bears’ attention.
WTI hourly chart
Trend: Further recovery expected