GBP/USD Price Analysis: Inside short-term falling channel
- GBP/USD struggles around the multi-year low.
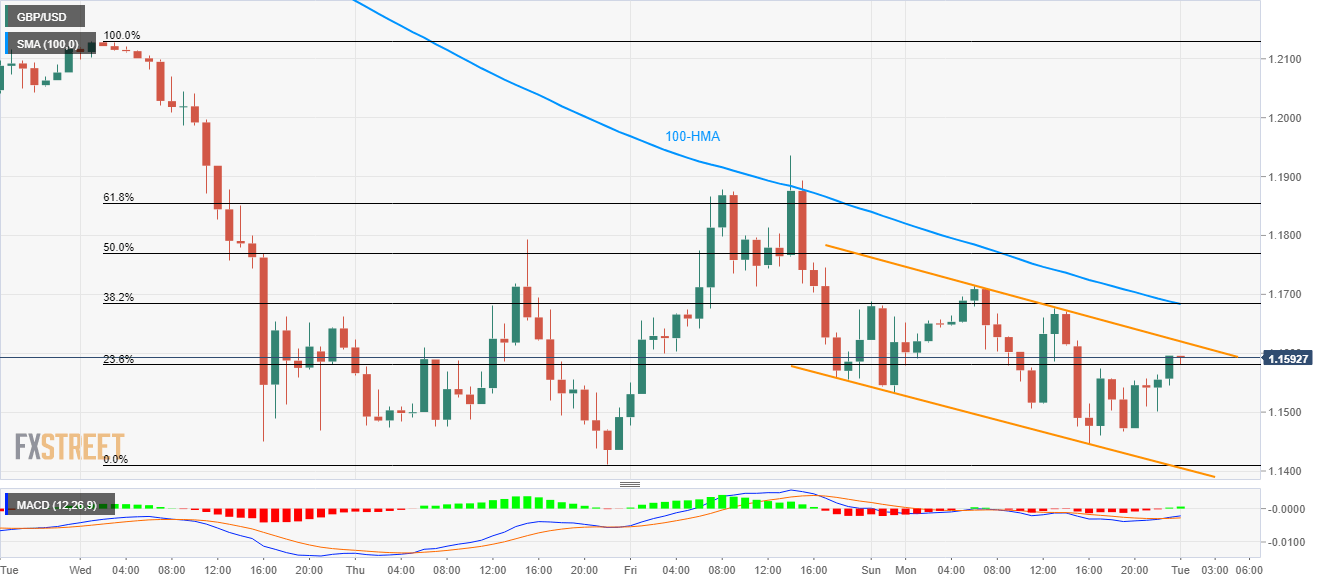
- A short-term bearish technical formation, 100-HMA restrict immediate upside.
- 1.1400 becomes the key support-confluence.
Despite marking 0.40% gains on the daily basis, GBP/USD recovery seems doubtful inside the immediate falling trend channel. The cable pair currently takes rounds to 1.1590 during the Asian session on Tuesday.
Even if the quote manages to cross 1.1620 channel resistance, a confluence of 100-Hour Moving Average (HMA) and 38.2% Fibonacci retracement of March 18/19 declines, around 1.1680/85 could question the buyers afterward.
If the recently bullish MACD help the quote to cross 1.1685, the pair can extend the recovery moves to the last-week top surrounding 1.1935.
Meanwhile, 1.1470 can offer immediate support to the pair during its pullback.
However, the channel’s support and the monthly low, also the lowest since 1985, around 1.1400 becomes the key support.
GBP/USD hourly chart
Trend: Bearish