Back
31 Mar 2020
USD/CHF Price Analysis: Mildly bid near 0.9600, seesaws around 50% Fibonacci
- USD/CHF extends Monday’s recovery moves from 38.2% Fibonacci retracement.
- 50-day SMA, 61.8% Fibonacci retracement question buyers.
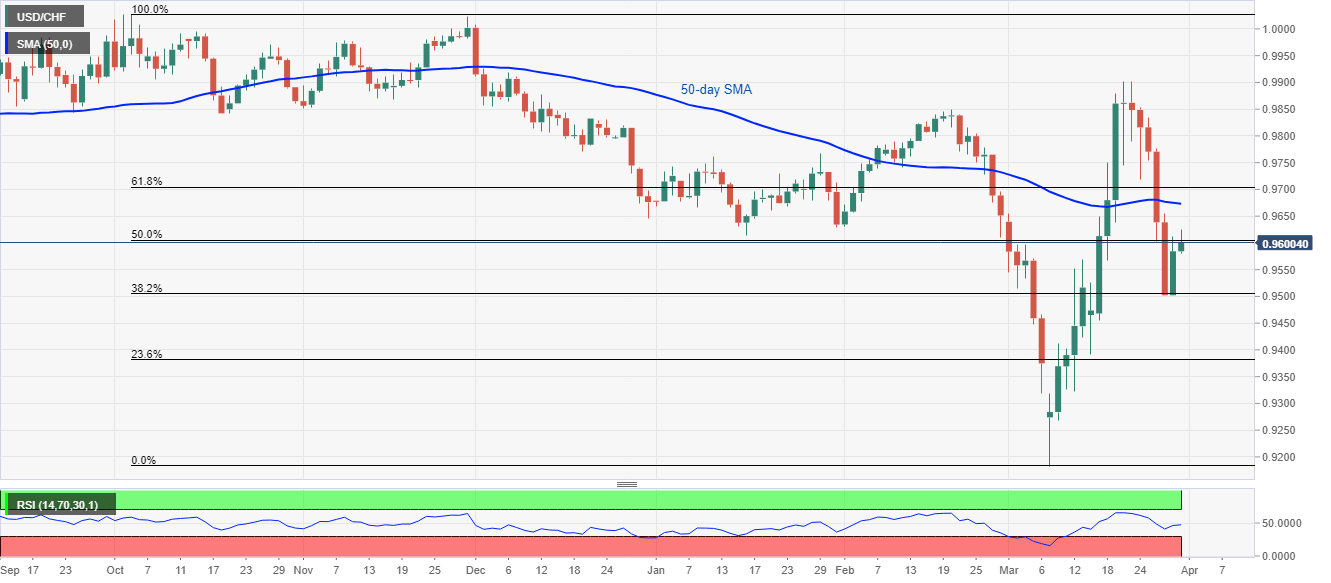
USD/CHF keeps the previous day’s U-turn while taking rounds to 0.9600 ahead of the European session on Tuesday. In doing so, the pair struggles around 50% Fibonacci retracement of its fall from October 2019 while also staying below 50-day SMA.
However, price-positive RSI conditions seem to push the pair towards the immediate SMA resistance near 0.9670 ahead of questioning 61.8% Fibonacci retracement level of 0.9705.
In a case where the bulls dominate past-0.9705, January month high surrounding 0.9770 will be on their radars.
Alternatively, a daily close below 38.2% Fibonacci retracement level of 0.9505 can aim for 0.9410 and 0.9320 during the further downside.
USD/CHF daily chart
Trend: Sideways