Gold Price Analysis: Finding its footing and ready to rise ahead of the Fed – Confluence Detector
Gold has been consolidating its gains and now faces the Federal Reserve's rate decision. Will Chairman Jerome Powell propel the precious metal higher? How is XAU/USD positioned on the charts?
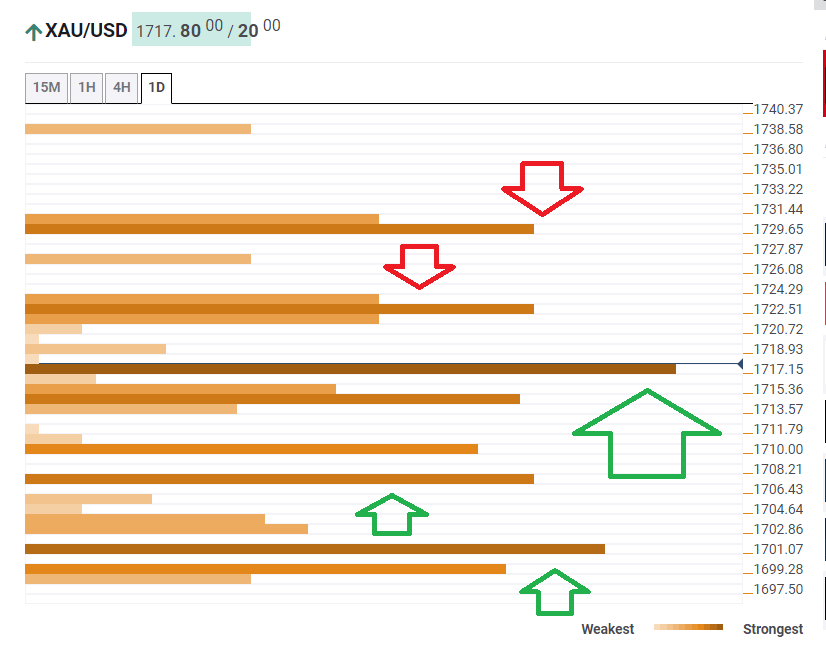
The Technical Confluences Indicator is showing that gold is trading above support at $1,717, which is the convergence of the Simple Moving Average 200-4h, the SMA 5-1h, the SMA 10-15m, the Fibonacci 61.8% one-week, the Bollinger Band 15min-Middle, and more.
There are several cushions further to the downside, with a significant cluster at $1,707, which is where the SAM 10-4h and the Fibonacci 61.8% one-month.
Further down, the next noteworthy support line awaits at $1,701, which is where the 50-day Simple Moving Average hits the price.
Resistance awaits at $1,722, which is where the previous daily high, the SMA 100-4h, and the Bollinger Band one-day Middle all meet.
The upside target is $1,730, which is the confluence of the Fibonacci 38.2% one-month and the Pivot Point one-week Resistance 1.
All in all, the path of least resistance is down
Here is how it looks on the tool:
Confluence Detector
The Confluence Detector finds exciting opportunities using Technical Confluences. The TC is a tool to locate and point out those price levels where there is a congestion of indicators, moving averages, Fibonacci levels, Pivot Points, etc. Knowing where these congestion points are located is very useful for the trader, and can be used as a basis for different strategies.
This tool assigns a certain amount of “weight” to each indicator, and this “weight” can influence adjacents price levels. These weightings mean that one price level without any indicator or moving average but under the influence of two “strongly weighted” levels accumulate more resistance than their neighbors. In these cases, the tool signals resistance in apparently empty areas.
Learn more about Technical Confluence