NZD/USD Price Analysis: Immediate resistance line probes pullback from 21-day SMA
- NZD/USD stretches recovery moves from 21-day SMA, still under near-term key resistance line.
- Bearish MACD probes the buyers, 200-day SMA offers additional support to watch.
- A three-month-old ascending trend line portrays the broad bullish play.
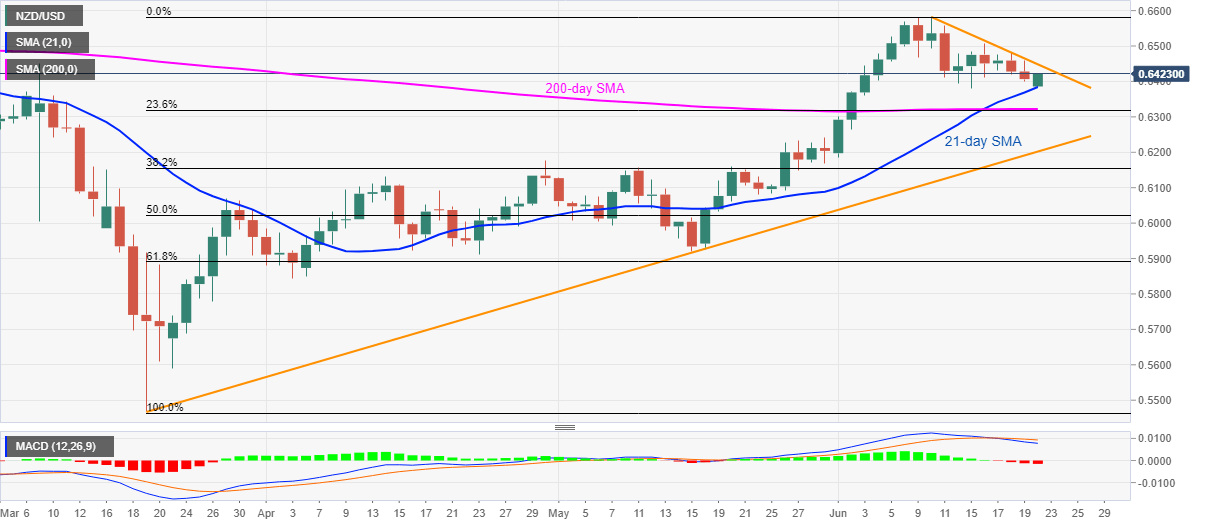
NZD/USD prints 0.18% gains while taking the bids near 0.6418 during the early Monday’s trading. In doing so, the pair bounces off 21-day SMA but stays below short-term important resistance. Other than the said falling trend line from June 10, the bearish MACD signals also question the pair’s recent pullback.
As a result, the buyers are likely to wait for a sustained break beyond the immediate resistance line, at 0.6450 now. Following that, the previous week’s top near 0.6510 could flash on their radars.
If at all the bulls manage to keep the dominance past-0.6510, the monthly high close to 0.6580 and 0.6600 round-figure will be in the spotlight.
Meanwhile, a downside break below the 21-day SMA level of 0.6385 can take a rest on the 200-day SMA level of 0.6322. However, an ascending trend line from March 19, currently at 0.6200, will be a tough nut to break for the sellers.
NZD/USD daily chart
Trend: Pullback expected