GBP/JPY Price Analysis: Upside momentum was lost and now the price is wrestling with the 200 SMA
- GBP/JPY trades just above flat on Thursday after trading much higher earlier in the session.
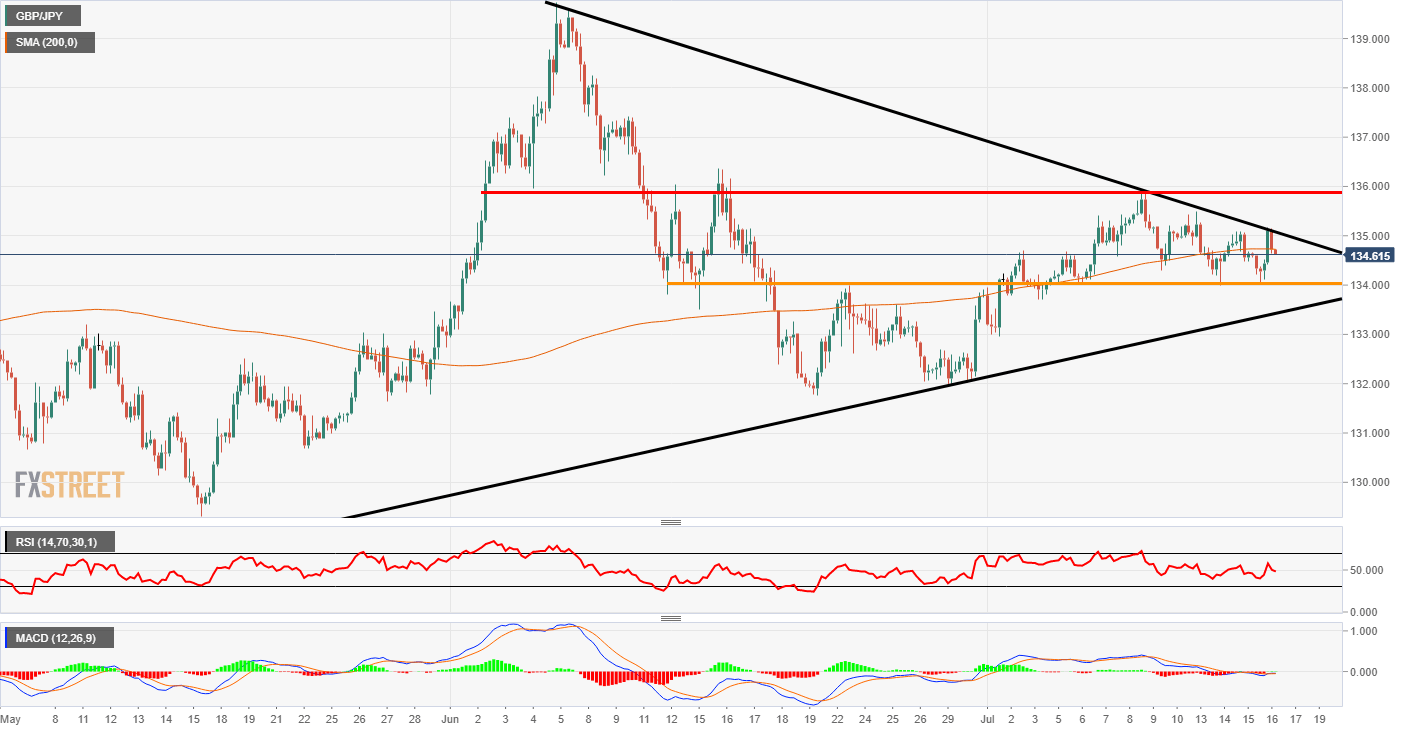
- The price rejected a trendline on the upside and now the price is at the 200 SMA.
GBP/JPY 4-hour chart
GBP/JPY stumbles at the downward sloping trendline on the chart below. The market rejected the 135.00 area and is now resting on the 200 Simple Moving Average. If the price continues to move lower then the next support line is at the orange area just above 134.00. Beyond that, the upward sloping black trendline could stem any further losses. There is no clear and obvious trend on this chart and the price has been moving sideways since the middle of July.
Looking at the indicators, they are mixed at the moment. The Relative Strength Index looks set to dip below the 50 area, which is a bearish sign. The MACD histogram is green but the signal lines are under the zero level. The histogram bars are diminishing in size so there could be a break to the downside.
Most of the JPY pairs are in a sideways range at the moment and it seems that there needs to be some kind of shakeout. A break of either side of the triangle could be the start of that movement.
Additional levels