AUD/USD Price Analysis: Sell the bounce around 100-SMA on 4H, US CPI eyed
- AUD/USD tracks the bounce in S&P 500 futures.
- The aussie 4H chart warrants further losses.
- Pullbacks to remain capped by 100-HMA.
AUD/USD has staged a decent bounce from daily lows of 0.7109, as the risk sentiment improves in early Europe.
The shift in the market mood is reflected by a 0.50% jump in the S&P 500 futures, which aids the aussie rebound.
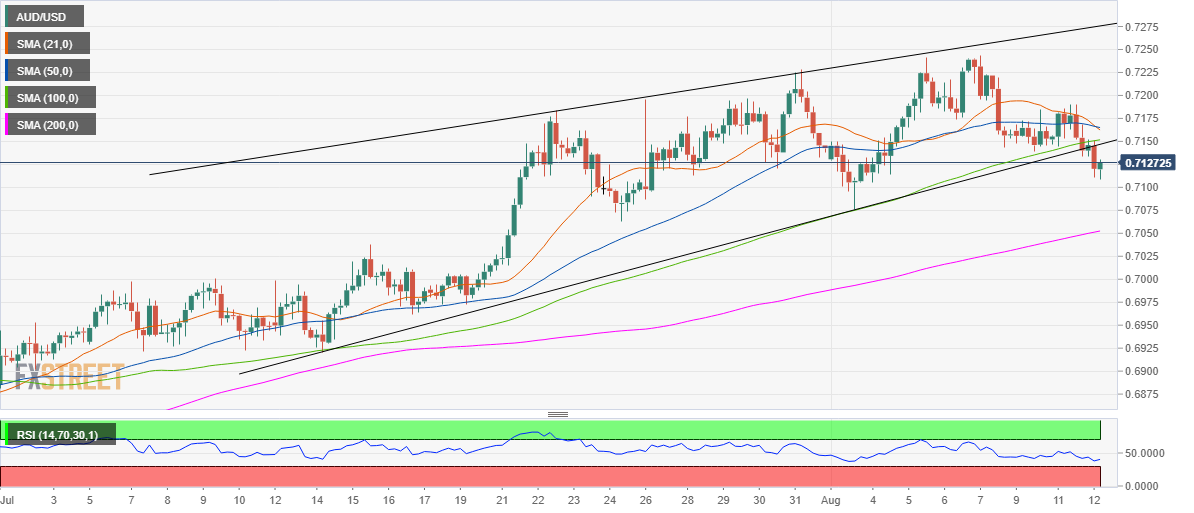
As observed in the four-hour chart, the spot has displayed a rising wedge breakdown in early Asia. Meanwhile, the 21 and 50-Simple Moving Averages (SMA) bearish crossover added credence to the sell-off from near 0.7190 region.
The downside momentum accelerated after the price breached the 0.7150 level, which is the confluence of the 100-SMA and rising trendline (pattern) support.
The risks remain to the downside amid the bearish break, with a test of the upward-sloping 200-SMA at 0.7052 on the cards.
However, with the Relative Strength Index (RSI) inching slightly higher, a minor pullback cannot be ruled out.
The bulls could test the previous support-turned-resistance at 0.7150 on the road to recovery. Although it is a tough nut to crack, recapturing the latter would open doors towards the 0.7162/65, the point of the bearish crossover mentioned above.
AUD/USD: 4H chart
AUD/USD: Additional levels