Silver Price Analysis: XAG/USD set to test multi-year highs at $29.85
- Silver bulls gathering pace for a fresh leg higher.
- Rectangle breakout spotted on the hourly chart.
- Hourly RSI in the overbought region, upside not yet over.
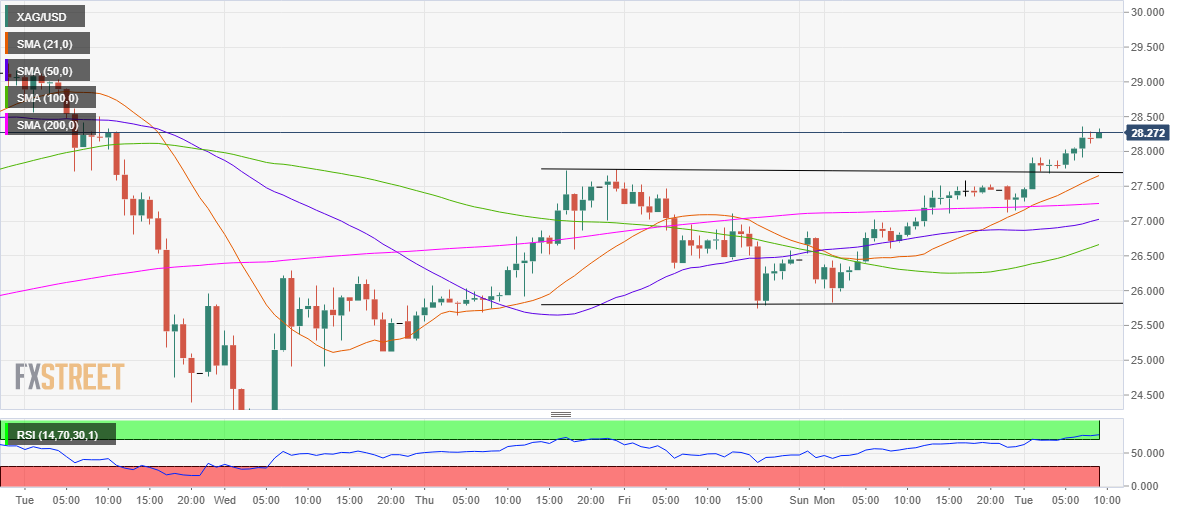
Silver (XAG/USD) has finally dived out of the three-day horizontal channel on the hourly sticks, validating the bullish break above the $27.75 level.
The hourly Relative Strength Index (RSI) points north in the overbought territory, implying there is more scope for the upside. Also, the price trades above all the major hourly Simple Moving Averages (HMA).
The bulls look to test the pattern target at $29.75, which is close to the 7.5-year highs of $29.85, reached last week.
On its way to multi-year highs, the $29 level could challenge the bulls’ commitment. The next hurdle is aligned at $29.27/41 (Aug 11 & 10 highs).
Alternatively, the bulls could be offered immediate respite at $27.75/70 area, the confluence of the pattern resistance-turned-support and bullish 21-HMA.
A break below the latter could call for a test of the horizontal 200-HMA at $27.25. A daily closing below the 200-HMA is needed to negate the near-term bullish momentum.
XAG/USD: Hourly chart
XAG/USD: Additional levels