GBP/USD Price Analysis: Recovery moves eye previous support above 1.2900
- GBP/USD maintains pullback from 100-day SMA, two week low.
- Normal RSI conditions favor further consolidation before meeting the short-term resistance.
- Falling trend line from October 21 adds to the resistances, the 1.2800 threshold can probe bears below the key SMA.
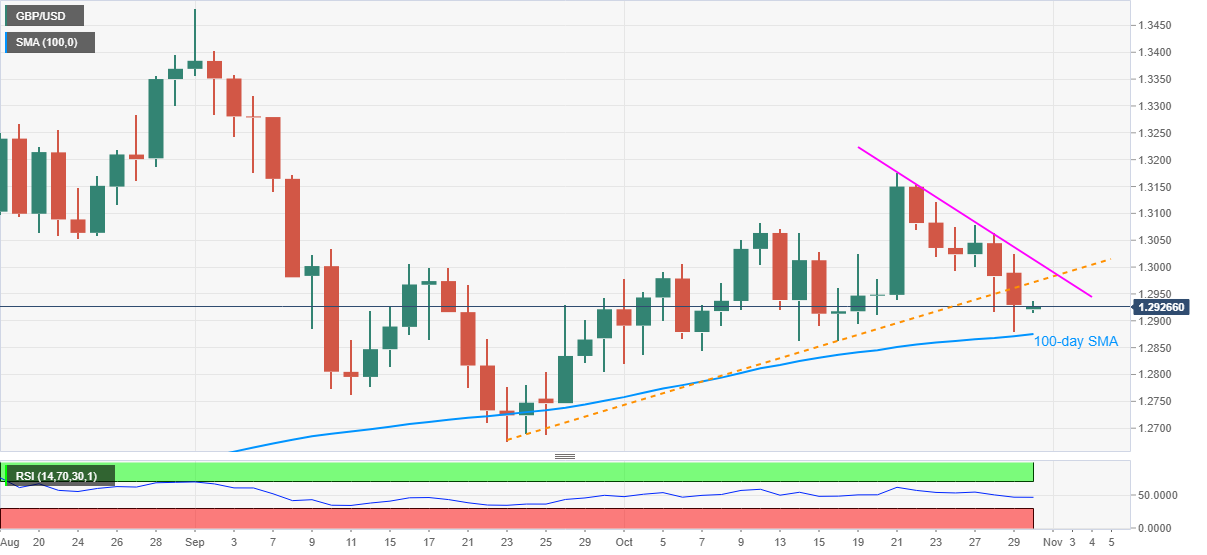
GBP/USD picks up bids around 1.2930 during the initial hour of Tokyo open on Friday. The cable dropped to the lowest since October 16 the previous day, before bouncing off 100-day SMA.
Considering the normal RSI levels, the latest corrective moves may aim for the previous support line stretched from September 23, at 1.2971 now.
While the pair’s ability to cross 1.2971 can help it conquer the 1.3000 psychological magnet, a one-week-old falling trend line near 1.3015 will challenge the GBP/USD bulls afterward.
Alternatively, a downside break of the 100-day SMA level of 1.2875 will direct the sellers towards the monthly low of 1.2819 and then to the 1.2800 round-figure.
However, any further weakness by the GBP/USD prices, below 1.2800, may not refrain from probing the previous month’s low of 1.2675.
GBP/USD daily chart
Trend: Pullback expected