USD/CAD Price Analysis: Bounces off intraday low as bears struggle to keep 1.2700
- USD/CAD stays mildly offered inside a short-term descending triangle.
- Normal RSI conditions suggest further weakness, 200-bar SMA adds to the upside barriers.
USD/CAD remains on the back-foot near the weekly low of 1.2706, currently down 0.18% near 1.2711, during early Wednesday. In doing so, the quote portrays a descending triangle bullish chart pattern while also staying below 200-bar SMA.
Considering the absence of oversold RSI conditions, USD/CAD selling is likely to stretch towards the stated triangle’s support. However, key events like the monetary policy meeting of the Bank of Canada and US President-elect Joe Biden’s inauguration ceremony in the White House, probe the sellers.
Read: Bank of Canada Rate Decision Preview: No change anticipated in interest rate
During the quote’s downside towards the triangle support near 1.2630-25, the 1.2660 level can act as an intermediate halt.
It should additionally be noted that USD/CAD bears’ dominance past-1.2625 will be tested by the 1.2600 round-figure ahead of highlighting the April 2018 low around 1.2525.
Alternatively, an upside break of the triangle should have enough strength to cross 200-bar SMA, currently around 1.2770 to aim for the monthly near 1.2835 and the late-December top close to 1.2960.
In a case where the USD/CAD rallies past-1.2960, the 1.3000 psychological magnet and December 2020 top of 1.3010 will be the key to watch.
USD/CAD four-hour chart
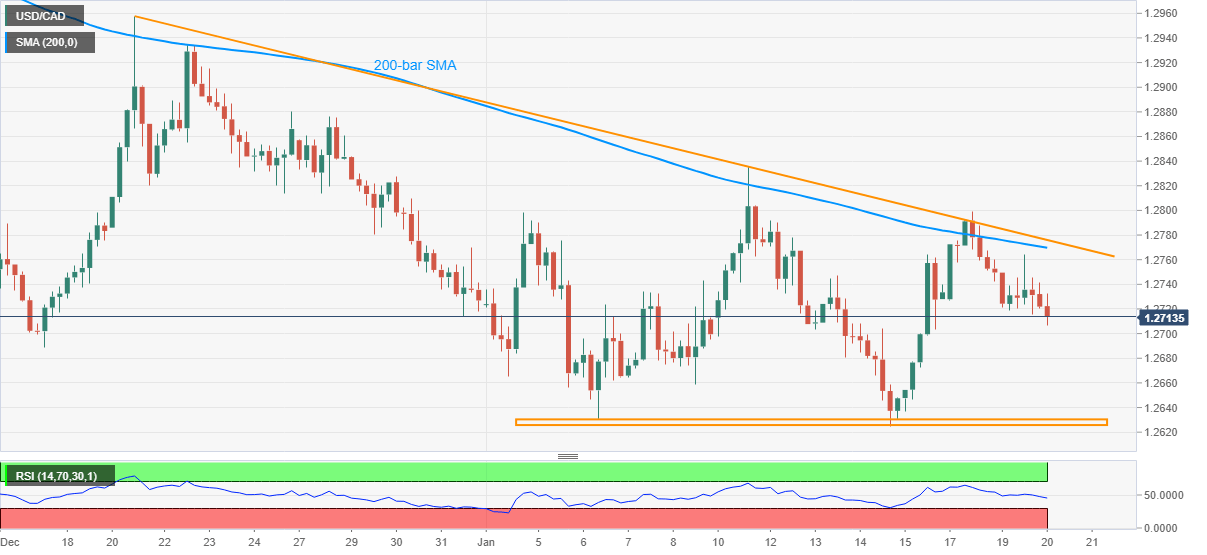
Trend: Further weakness expected