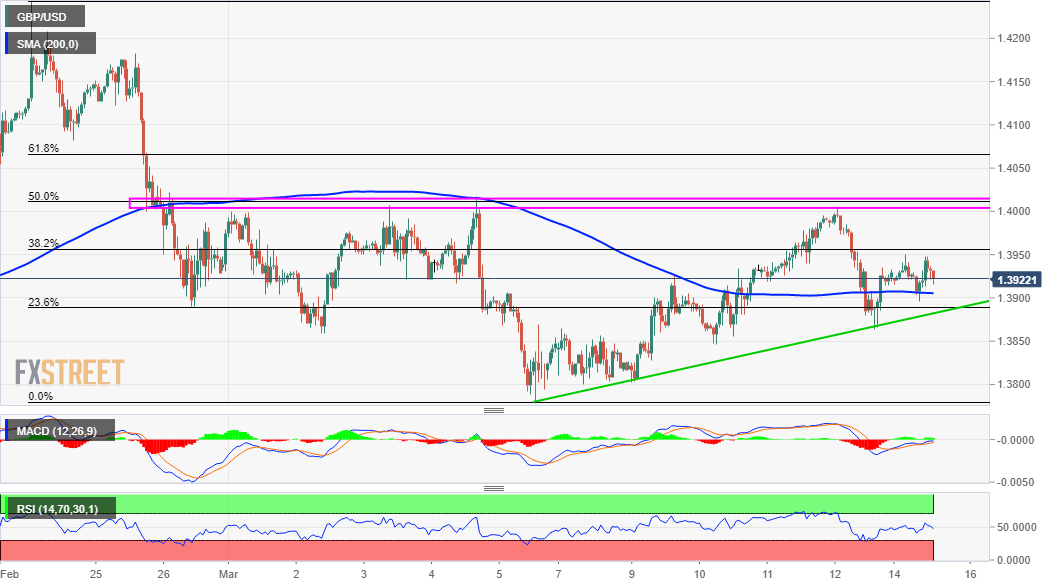
GBP/USD Price Analysis: Stuck in a range above 1.3900 mark/200-hour SMA
- GBP/USD struggled for a firm direction and remained confined in a range on Monday.
- Failures near 1.4000 favour bearish traders; the emergence of dip-buying warrants caution.
- Neutral oscillators further make it prudent to wait for a sustained move in either direction.
The GBP/USD pair seesawed between tepid gains/minor losses through the mid-European session and was last seen trading in the neutral territory, around the 1.3920-25 region.
Repeated failures near the key 1.4000 psychological mark, which coincides with the 50% Fibonacci level of the 1.4243-1.3779 corrective slide, constitutes the formation of bearish multiple tops. That said, the GBP/USD pair, so far, shown some resilience below the 1.3900 round-figure mark, or 200-hour SMA.
This is closely followed by the 1.3980-85 confluence region, comprising of over one-week-old ascending trend-line and the 23.6% Fibo. of the 1.4243-1.3779 corrective slide. Bearish traders are likely to wait for a convincing break through the mentioned support before positioning for any further downfall.
Meanwhile, neutral technical indicators on 4-hourly/daily charts haven't been supportive of any firm direction. Investors now seemed reluctant to place any aggressive bets and preferred to wait on the sidelines ahead of the FOMC policy decision on Wednesday and the Bank of England meeting on Thursday.
In the meantime, sustained weakness below the mentioned confluence support will be seen as a fresh trigger for bearish traders. This might turn the pair vulnerable to accelerate the slide towards testing the 1.3830-25 intermediate support en-route monthly lows, around the 1.3780 region.
On the flip side, immediate resistance is pegged near the 1.3955-60 region (38.2% Fibo. level), which if cleared decisively might push the GBP/USD pair back towards the 1.4000 mark. Some follow-through buying should pave the way for a move towards the 1.4070 area (61.8 Fibo.) ahead of the 1.4100 mark.
GBP/USD 1-hourly chart
Technical levels to watch