Silver Price Analysis: Rising wedge favours XAG/USD bears, break below 200-HMA awaited
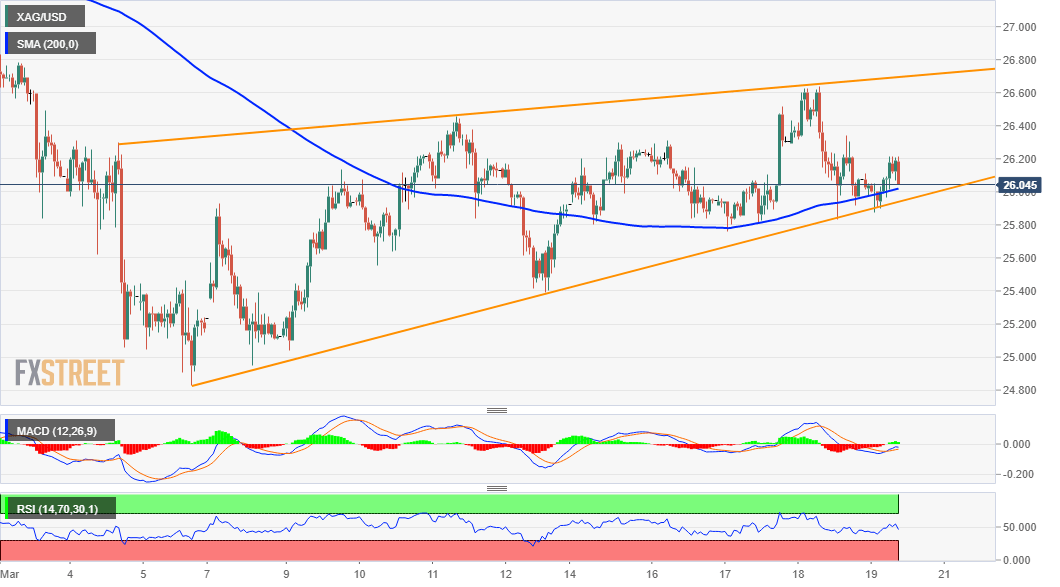
- Silver has been oscillating between two converging trend-lines, forming a bearish wedge.
- The pattern support coincides with 200-hour SMA and should act as a key pivotal point.
Silver edged lower on the last trading day of the week and was last seen hovering near daily lows, around the $26.00 mark. That said, the commodity, so far, has managed to hold its neck above 200-hour SMA support, though the near-term bias seems tilted in favour of bearish traders.
The recent price moves have been confined between two upward sloping converging trend-lines. This constitutes the formation of a bearish rising wedge chart pattern and supports prospects for further weakness. The pattern support, currently around the $26.00-$25.90 region coincides with 200-hour SMA and should act as a pivotal point. A convincing break below will mark a fresh bearish breakdown and prompt some aggressive selling.
The XAG/USD might then accelerate the slide further towards intermediate support near the $25.40-35 zone en-route the key $25.00 psychological mark. This is followed by monthly swing lows, around the $24.85 region. Some follow-through selling should pave the way for an extension of the recent sharp pullback from the $30.00 level and drag the XAG/USD towards the very important 200-day SMA, currently near the $24.00 round-figure mark.
On the flip side, any meaningful positive move might still be seen as a selling opportunity and confront stiff resistance near the $26.50-60 region. The mentioned barrier coincides with the top end of the wedge pattern, which if cleared decisively will negate the bearish bias. The subsequent short-covering move has the potential to lift the XAG/USD back beyond the $27.00 mark, towards the next relevant hurdle near the $27.30 supply zone.
XAG/USD 1-hourly chart

Technical levels to watch
