NZD/USD Price Analysis: Teasing a rising channel breakdown on the 1H chart
- NZD/USD sellers fighting back control after the impressive rally to six-week tops.
- The US dollar is back on the bid while China’s industrial profits skyrocket in March.
- The kiwi eyes 50-HMA support is the selling pressure intensifies.
NZD/USD is correcting from six-week highs of 0.7244, although holds well above 0.7200 despite a broad US dollar comeback.
Higher copper and iron-ore prices seem to be the key drivers behind the latest surge in the commodities-linked currencies.
At the time of writing, the Kiwi drops 0.17% on a daily basis to trade around 0.7220, finding some support from a massive increase in the Chinese industrial profits for March. However, the 92.3% YoY jump in the profits is mainly due to the base effect.
All eyes remain on the FOMC decision and New Zealand’s employment data this week for fresh direction on the prices.
NZD/USD technical outlook
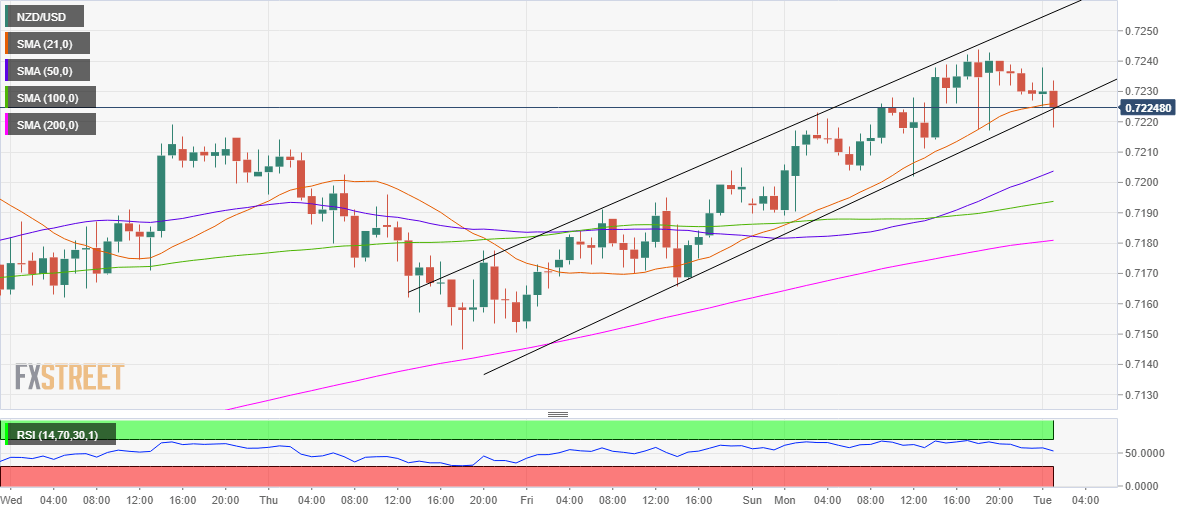
From a near-term technical perspective, the kiwi is on the verge of confirming a rising channel breakdown.
The price should close the hourly candlestick below the rising trendline support at 0.7226 to validate the downside break.
An additional downside could open up towards the ascending 50-hourly moving average (HMA) at 0.7203.
The next stop for the NZD bears is seen at the mildly bullish 100-HMA at 0.7194.
The 14-day Relative Strength Index (RSI) points south but holds above the midline, keeping the bulls hopeful.
NZD/USD hourly chart
The 14-day Relative Strength Index (RSI) points south but holds above the midline, keeping the bulls hopeful.
Therefore, the kiwi needs to defend the key support at 0.7226, where the 21-HMA also coincides.
The multi-week tops at 0.7244 could then be back on the buyers’ radars.
NZD/USD additional levels to watch