Gold Price Analysis: XAU/USD trades on shaky ground as support looks weak– Confluence Detector
- Gold has been marginally retreating from the highs as markets look for a new direction.
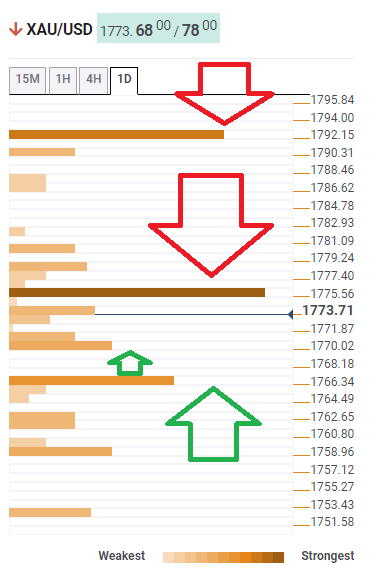
- The Confluence Detector is showing that XAU/USD has stronger resistance than support.
- Gold Weekly Forecast: XAU/USD looks to extend rebound ahead of FOMC Minutes
Taper tantrum? It is hard to call a marginal decline in stocks as an outright "tantrum" but fears that the Federal Reserve would reduce bond buys sooner than later are seeping in. On this background, gold is retreating from the highs reached in its comeback on Friday. Fed Chair Powell could signal the bank's next moves in a speech on Tuesday, and until then, technicals could have the upper hand.
How is XAU/USD positioned on the charts?
The Technical Confluences Detector is showing that XAU/USD is capped at $1,776, which is the convergence of the Simple Moving Average 10-15m, the 10-day SMA, the Bollinger Band 15min-Middle and the Pivot Point one-month Support 1.
Another strong resistance line awaits at $1,792, which is the meeting point between the all-important Fibonacci 61.8% one-month and the BB one-day Middle.
Looking down, gold only has weak support of $1,770, which is the confluence of the SMA 10-4h and the Fibonacci 38.2% one-day.
A somewhat more significant cushion awaits at $1,766, which is a juncture including the SMA 200-1h and the previous month's low. Nevertheless, these support lines are weaker than the resistance levels mentioned above.
All in all, the path of least resistance is down.
XAU/USD resistance and support levels
Confluence Detector
The Confluence Detector finds exciting opportunities using Technical Confluences. The TC is a tool to locate and point out those price levels where there is a congestion of indicators, moving averages, Fibonacci levels, Pivot Points, etc. Knowing where these congestion points are located is very useful for the trader, and can be used as a basis for different strategies.
Learn more about Technical Confluence