Gold Price Forecast: XAU/USD testing bearish commitments at $1780 ahead of Fed – Confluence Detector
- Gold price consolidates the two-day recovery, as focus shifts to Fed.
- Evergrande fears ease, risk appetite returns and DXY retreats.
- Gold bears in driver's seat as focus shifts to FOMC.
Gold price remains in the green for the fourth day in a row, consolidating the two-day recovery from over one-month lows of $1742. The bulls turn cautious and refrain from placing fresh bets ahead of the all-important Fed monetary policy decision, with increased expectations that Jerome Powell and company could offer a tapering timeline. If the Fed refrains from making any announcement on tapering, gold price could see buying resurgence, although the gains could be capped by the calm from China Evergrande and risk-on action in the US stocks.
Read: Will gold find acceptance above this key level? Evergrande, Fed in focus
Gold Price: Key levels to watch
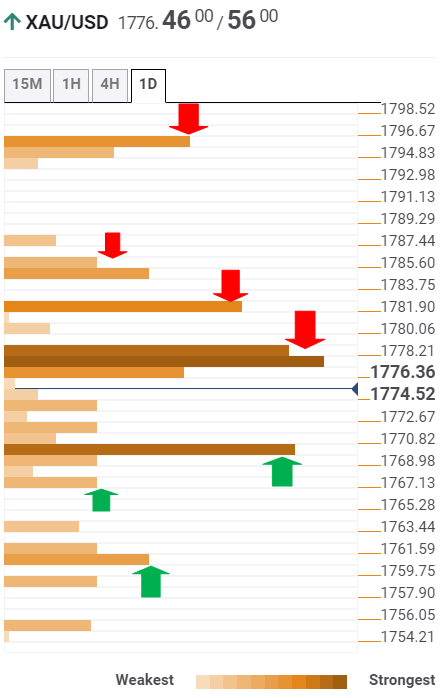
The Technical Confluences Detector shows that gold is failing to find acceptance above a stack of strong resistance levels around $1778, which is the intersection of the Fibonacci 61.8% one-month, Fibonacci 23.6% one-day and SMA50 four-hour.
Gold bulls will regain complete control above the latter, paving way for a test of $1782, where the SMA10 one-day and the previous day’s high converge.
The next relevant upside target is envisioned at $1785; the meeting point of the Fibonacci 61.8% one-week and the pivot point one-day R1.
If the buying interest intensifies, then a rally towards $1794 cannot be ruled out. At that point, the SMA50 one-day coincides with the pivot point one-day R2.
Alternatively, a strong cushion is seen at $1769, the intersection of the SMA5 one-day and Fibonacci 38.2% one-week.
The Fibonacci 61.8% one-day at $1766 will be the next downside target for sellers.
The last line of defense for gold bulls is aligned at $1761, the Fibonacci 23.6% one-week.
Here is how it looks on the tool
About Technical Confluences Detector
The TCD (Technical Confluences Detector) is a tool to locate and point out those price levels where there is a congestion of indicators, moving averages, Fibonacci levels, Pivot Points, etc. If you are a short-term trader, you will find entry points for counter-trend strategies and hunt a few points at a time. If you are a medium-to-long-term trader, this tool will allow you to know in advance the price levels where a medium-to-long-term trend may stop and rest, where to unwind positions, or where to increase your position size.