USD/JPY Price Analysis: Marches firmly towards 116.00 as US 10-year T-bond yield reaches 1.97%
- The USD/JPY advances sharply during the day some 0.45%.
- A mixed market mood keeps investors uneasy amid global central banks tightening conditions.
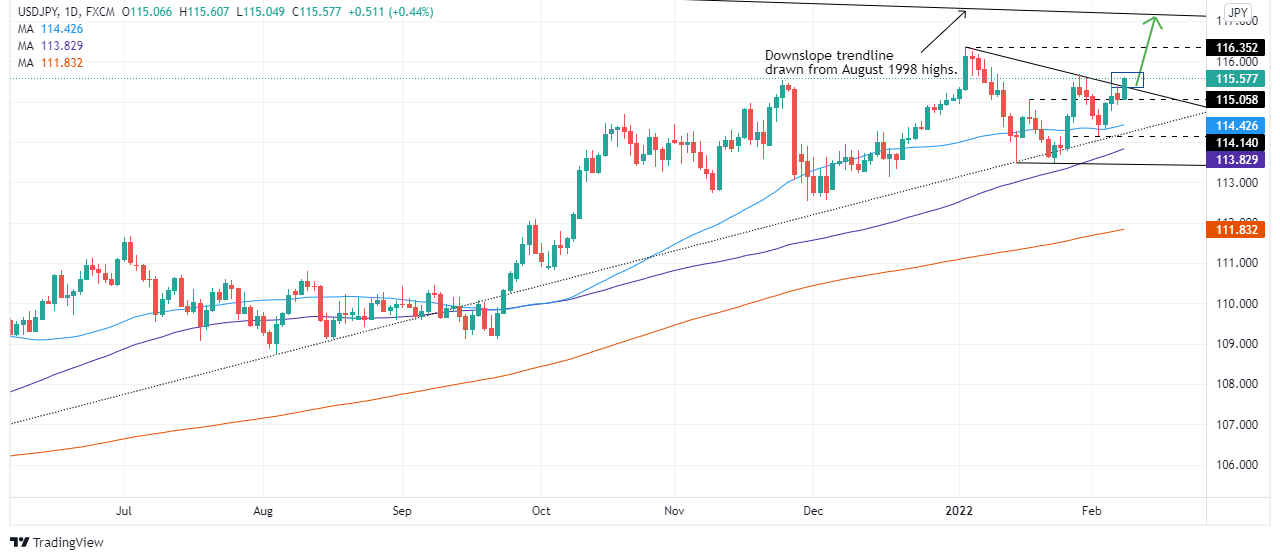
- USD/JPY is upward biased as USD bulls get ready to test a 24-year-old downslope trendline.
Tuesday’s price action of USD/JPY appears to be breaking a one-month-old downslope resistance trendline, drawn from January highs, which rejected Monday’s upward move, sending the pair towards its daily low under 115.00. At the time of writing, the USD/JPY is trading at 115.59.
The financial market’s mood seesaws as investors move in turbulent waters. Global central bank tightening monetary policy conditions and rising global bond yields keep market participants nervous.
US Treasury yields keep heading north as the New York session progresses. The US 10-year Treasury yield rises sharply and closes to the 1.97% threshold, weighing on the USD/JPY pair, which is closely correlated to it.
Analysts at Société Générale noted that “if we are going to see 10-year Note yields break 2% and the market price in a higher terminal Fed Funds rate (which seems highly likely) then USD/JPY 116 is going to break again and a move towards 120 will follow.”
USD/JPY Price Forecast: Technical outlook
The USD/JPT daily chart depicts the pair as upward biased. The daily moving averages (DMAs) reside well below the spot price, while the Relative Strength Index R(RSI=
The upward break mentioned in the first paragraph, confirmed by a daily close in those levels, would open the door for a test of the 2022 YTD high at 116.35. Breach of the latter could pave the way for further gains and expose a 24-year-old downslope trendline drawn from August 1998, swing highs which pass around 117.00. An upward break would expose the January 2017 swing high at 118.61.