Silver Price Analysis: XAG/USD dribbles on the way to $19.70
- Silver prices stabilize around 22-month low after the biggest drop in eight months.
- Clear break of 50% Fibonacci retracement level directs bears toward September 2019 peak.
- Corrective pullback needs validation from eight-month-old horizontal resistance, previous support.
Silver (XAG/USD) bears take a breather after the biggest daily fall since September 2021, taking rounds to $20.60-80 during Friday’s Asian session.
The bright metal dropped to the lowest levels since July 2020 the previous day while breaking the 50% Fibonacci retracement (Fibo.) of its run-up from March 2020 to February 2021.
In addition to the downside break of the key Fibo. level, bearish MACD signals and broad risk-off mood also keep XAG/USD sellers hopeful to visit the September 2019 high, around $19.65.
That said, the $20.00 psychological magnet may offer an intermediate halt during the fall whereas February 2020 high of around $19.00 could lure the silver bears past $19.65.
Alternatively, the corrective pullback may initially aim for the aforementioned Fibonacci retracement level near $20.85.
Following that, lows marked during September and December 2021, close to $21.40, could challenge the silver buyers.
Silver: Daily chart
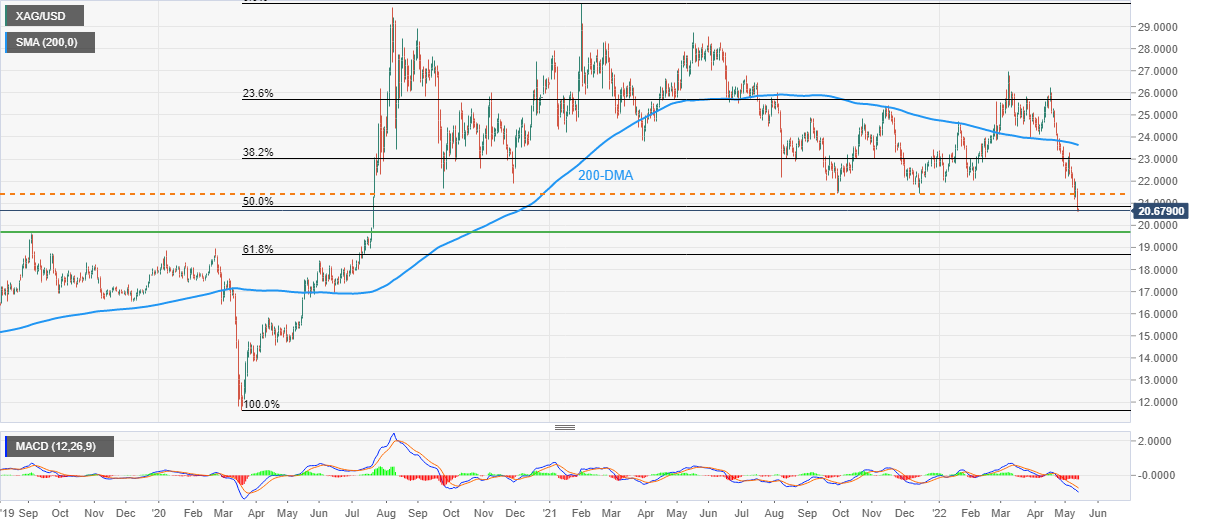
Trend: Bearish