NZD/USD Price Analysis: Bulls stay on the way to 0.6400
- NZD/USD holds onto the upside break of 50-DMA at six-week high.
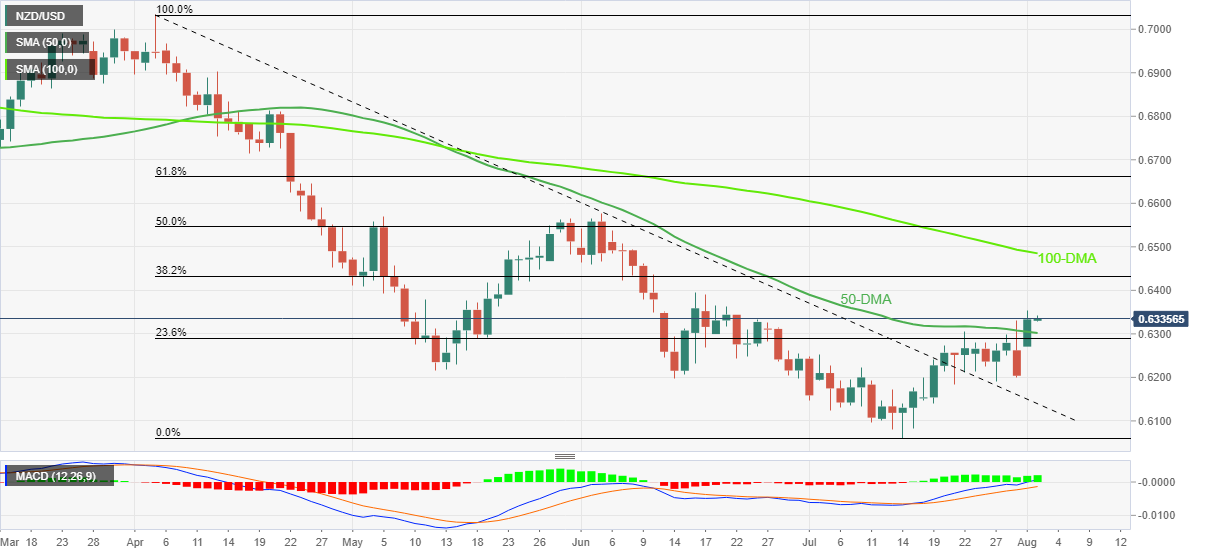
- Bullish MACD signals, sustained trading above the previous resistance line adds strength to the bulish bias.
- Mid-June high, 100-DMA lure buyers ahead of June’s peak.
NZD/USD grinds higher around the 1.5-month top after crossing the 50-DMA hurdle the previous day. That said, the Kiwi pair seesaws near 0.6335-40 during Tuesday’s Asian session.
In addition to the 50-DMA breakout, the pair’s successful trading beyond the downward sloping resistance line from April, now support around 0.6140, also keep buyers hopeful. Furthermore, bullish MACD signals and the higher low formation add strength to the bullish bias for the quote.
It’s worth noting that the pair’s further upside could aim for the mid-June swing high near 0.6400. However, the 38.2% Fibonacci retracement of the April-July downturn and the 100-DMA, respectively near 0.6435 and 0.6485, could challenge the NZD/USD buyers afterward.
On the flip side, pullback moves need validation from the 50-DMA level of 0.6302 to recall the sellers.
Following that, the previous resistance line from April and the recent lows, close to 0.6140 and 0.6060 in that order, could lure the NZD/USD bears.
Overall, NZD/USD prices recently crossed the key hurdle to the north and are likely to reverse the three-month-old downtrend.
NZD/USD: Daily chart
Trend: Further upside expected