Gold Price Forecast: XAU/USD bears keep eyes on $1,754 ahead of Fed – Confluence Detector
- Gold price is back in the red zone, as US Treasury yields see a renewed upside.
- Heft Fed rate hike expectations bolster the yields and the US dollar.
- XAU/USD bears target $1,754 and $1,751 as the downside resumes.
Gold price has stalled its two-day recovery mode from 29-month lows but remains within a familiar range between $1,680 and $1,650. Investors refrain from placing any directional bets on the bright metal ahead of the Fed and BOE rate hike decisions, which could have a significant impact on risk sentiment and the US dollar valuations. The Fed is widely expected to hike rates by 75 bps this week, although a slim chance of 100 bps rise still remains on the cards. Aggressive global tightening bets weigh negatively on the non-interest-bearing gold at a time when the US Treasury yields are surging to multi-year highs across the time curve.
Also read: Gold Price Forecast: XAU/USD bulls to remain cautious below $1,700 amid pre-Fed anxiety
Gold Price: Key levels to watch
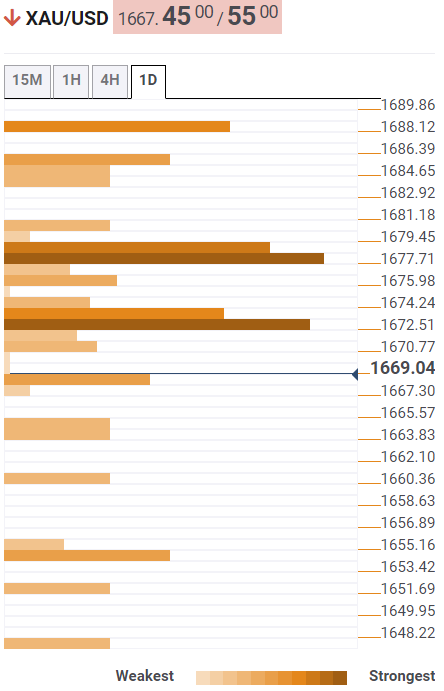
The Technical Confluence Detector shows that the gold price has breached the Fibonacci 61.8% one-day support at $1,667.
Bears are now geared up to test the Bollinger Band one-day Lower at $1,664. The previous day’s low of $1,660 will be the next downside target.
Further south, the previous week’s low at $1,654 and the pivot point one-day S2 at $1,651 could come to the rescue of XAU buyers should the selling momentum pick up steam.
On the flip side, the $1,672 hurdle could into play once again. That level is the confluence of the Fibonacci 38.2% one-day and the Fibonacci 23.6% one-week.
The previous year’s low of $1,677 will offer stiff resistance on the road to recovery, above which bulls will challenge the previous day’s high of $1,680.
Here is how it looks on the tool

About Technical Confluences Detector
The TCD (Technical Confluences Detector) is a tool to locate and point out those price levels where there is a congestion of indicators, moving averages, Fibonacci levels, Pivot Points, etc. If you are a short-term trader, you will find entry points for counter-trend strategies and hunt a few points at a time. If you are a medium-to-long-term trader, this tool will allow you to know in advance the price levels where a medium-to-long-term trend may stop and rest, where to unwind positions, or where to increase your position size.
