WTI Price Analysis: Eases from previous support near $82.00 inside falling wedge
- WTI snaps two-day uptrend, pares daily gains after rising the most since May.
- Bullish chart pattern, upside oscillators keep buyers hopeful but 100-SMA adds to the upside filters.
- Multiple supports to challenge bears above $75.00 level.
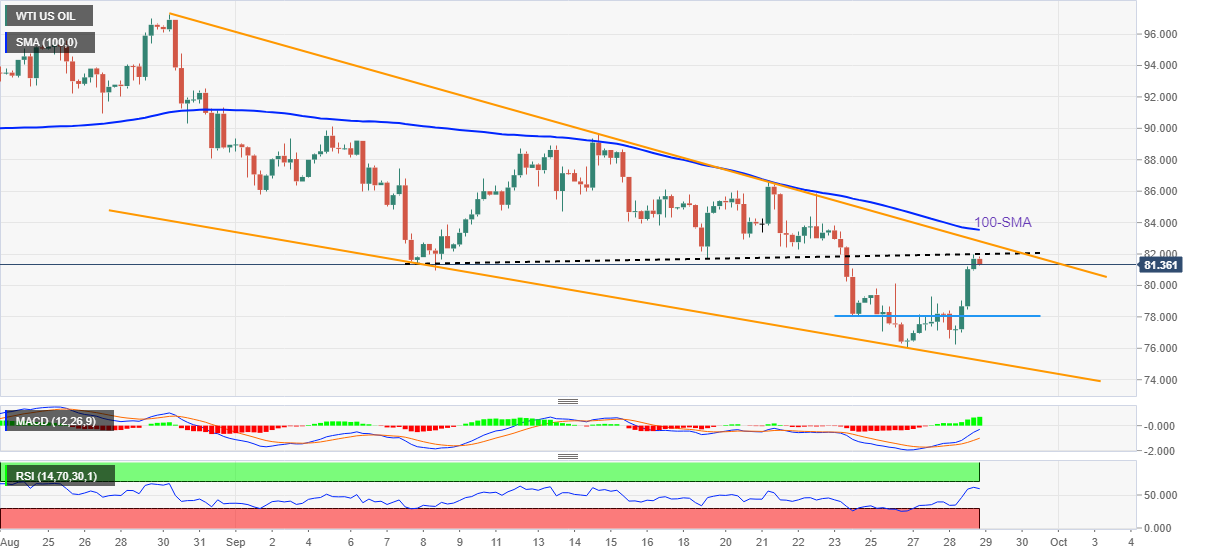
WTI crude oil prices fade the previous day’s upside momentum, the biggest in four months, as bulls take a breather at around $82.00 during Thursday’s Asian session. That said, the black gold retreats to $81.30 by the press time.
In doing so, the quote eased from the previous support line from September 07 while staying inside the monthly falling wedge bullish chart pattern.
Given the recently firmer RSI and the bullish MACD signals, the commodity prices are likely to extend the latest hurdle surrounding $82.00.
However, the quote’s further upside will hinge on the capacity to confirm the wedge formation with a clear break of $82.80, as well as cross the 100-SMA hurdle surrounding $83.55.
On the contrary, pullback moves may revisit the $80.00 threshold ahead of weekly horizontal support near $78.00.
In a case where the quote drops below $78.00 support, the latest multi-month low near $76.00 and the lower line of the stated wedge, around $75.20, could challenge the further downside of WTI crude oil.
WTI: Four-hour chart
Trend: Further upside expected