AUD/USD bulls move in on a key resistance ahead of RBA
- AUD/USD bulls ta,e the lead ahead of the RBA today.
- The US dollar is soft on the back of lower US yields and poor US data.
AUD/USD rallied on Monday on the back of a softer US dollar and yields. The greenback fell within demand while the 10-year yield slipped to test critical support levels on the downside. AUD/USD is trading some 1.8% higher into early Asian markets following a rise from 0.6399 to 0.6522 the high and is recovering slightly from an over 2-year closing low ahead of the main domestic event for the week in the Reserve Bank of Australia interest meeting.
The RBA is expected to raise the cash rate by 50 basis points to combat inflation but the Aussie could come under pressure should there be any dovish hints given that policymakers said last time around that the central bank was looking for opportunities to slow the pace of rate hikes at some point. The latest inflation data showed that consumer prices in Australia eased to 6.8% in August from a record high of 7% in July on a year-to-date basis. The RBA has already hiked the cash rate by an aggregate of 225 basis points to a seven-year high of 2.35%.
Meanwhile, the US dollar was softer by 0.4% and stocks on Wall Street ended sharply higher on Monday. The Dow finished +2.7%, the S&P 500 closed +2.6% and the Nasdaq Composite ended +2.3%. The 10-year Treasury yield fell 14 basis points to 3.66% and at one point dropped by 20 basis points. The 2-year yield declined 9 basis points to 4.12%.
In economic data, ISM manufacturing index data, which provides a gauge for manufacturing activity in the US, came in lower than expected. The ISM reported a figure of 50.9 for September, lower than the forecasted 52.2.
AUD/USD and DXY technical analysis
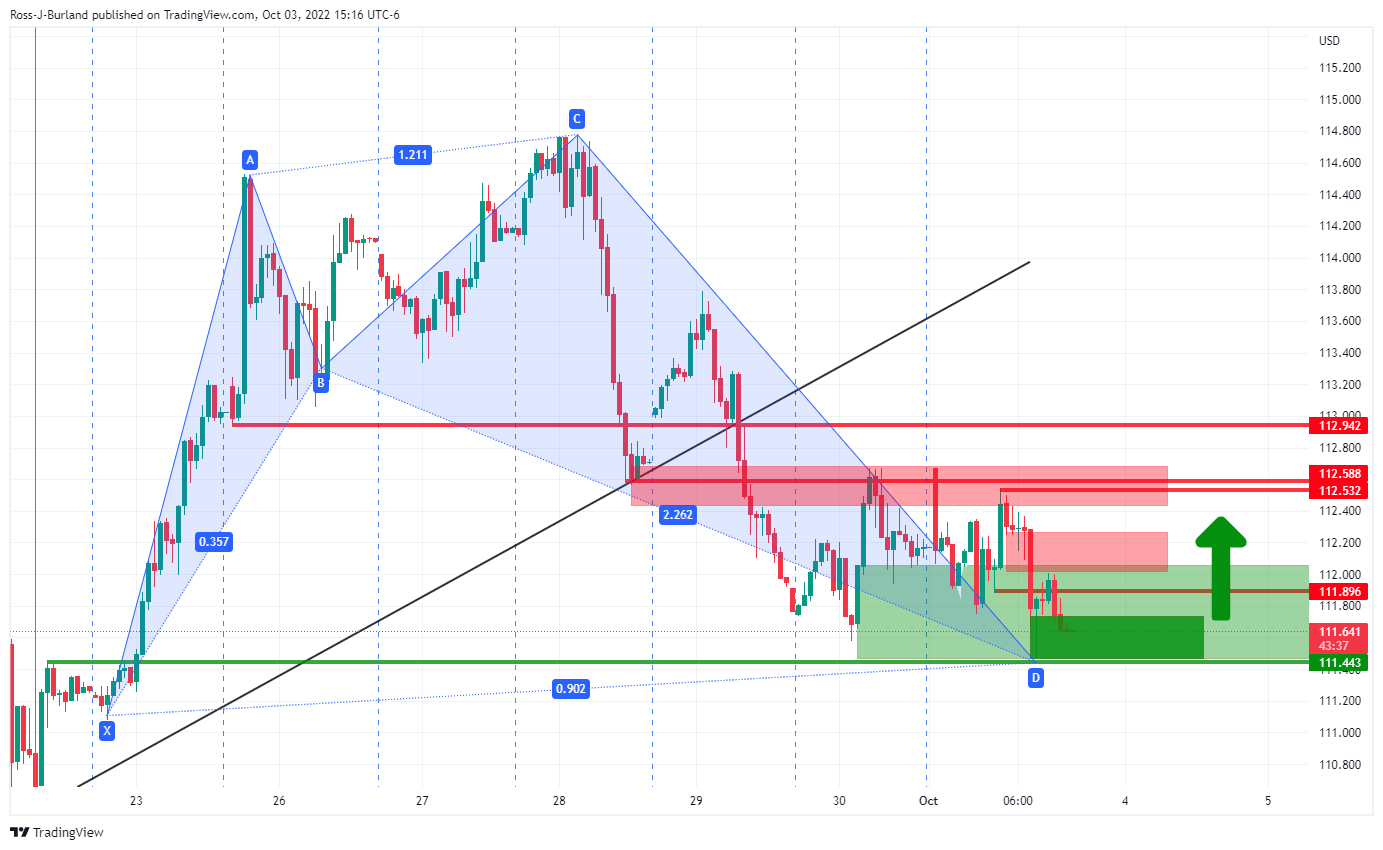
The dollar is offered to a key support level but the bullish harmonic shark pattern could see the price move in again on the 112 area imminently. This would be the basis for a bearish thesis on AUD/USD that is testing resistance currently:
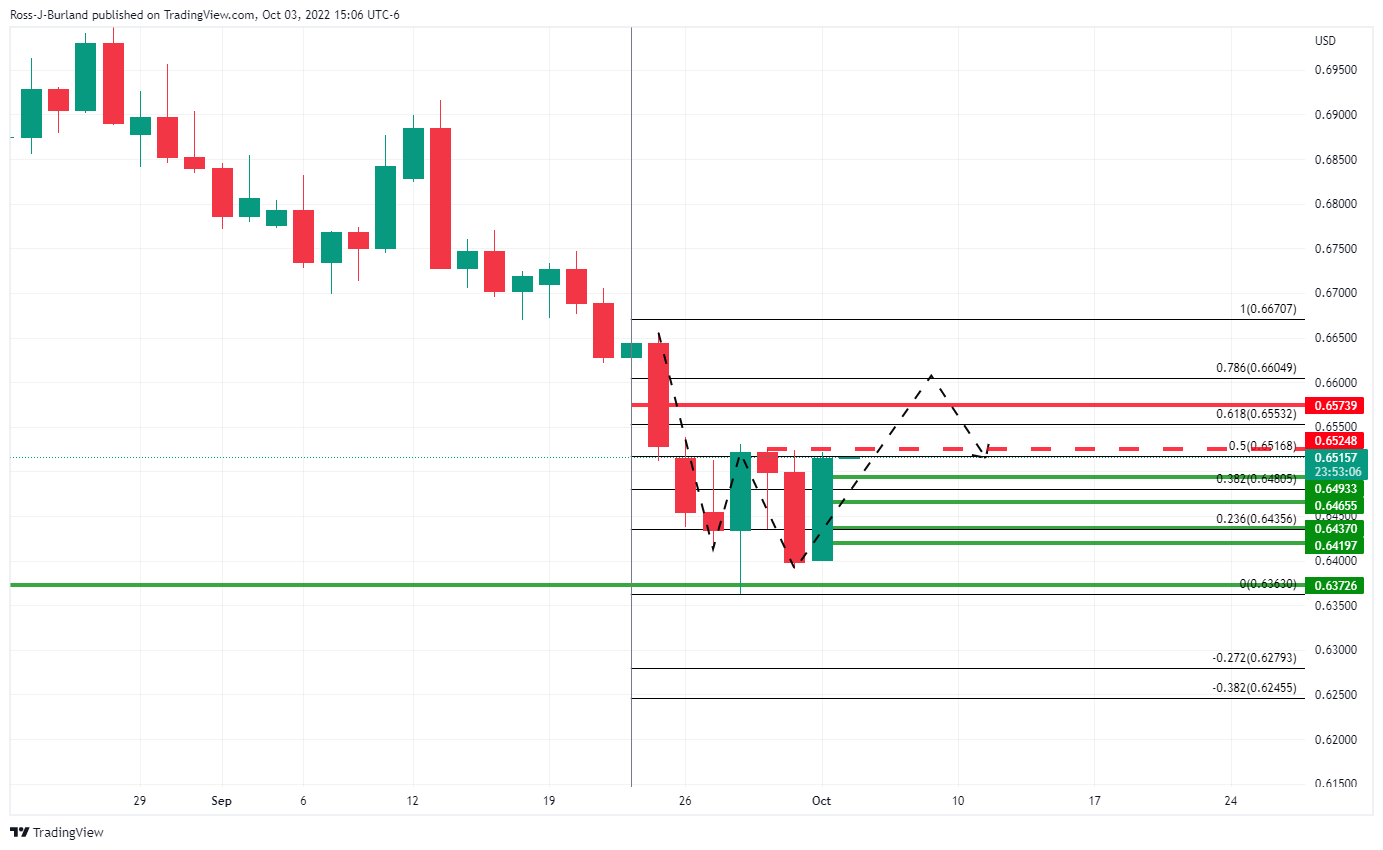
However, should the bulls get above resistance, there will be a case for a bullish W-formation, as per the daily chart above.
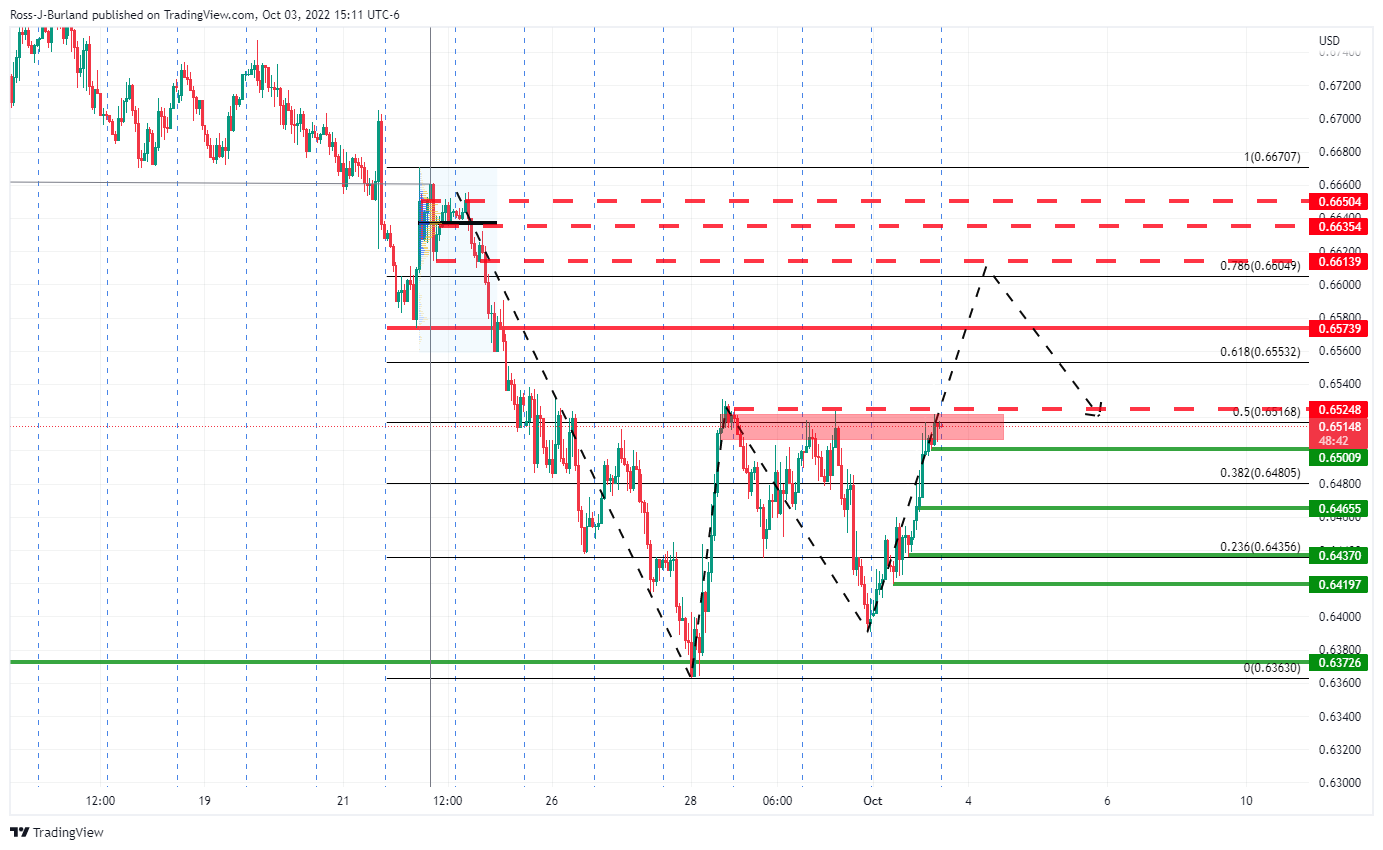
The hourly chart's bullish scenario levels to watch are in red, and bearish in green.